MPC555CME Freescale Semiconductor, MPC555CME Datasheet - Page 702
MPC555CME
Manufacturer Part Number
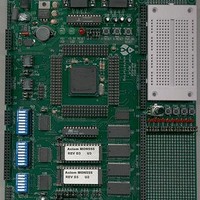
MPC555CME
Description
KIT EVALUATION FOR MPC555
Manufacturer
Freescale Semiconductor
Type
Microcontrollerr
Datasheet
1.MPC555CME.pdf
(966 pages)
Specifications of MPC555CME
Contents
Module Board, Installation Guide, Power Supply, Cable, Software and more
Processor To Be Evaluated
MPC555
Data Bus Width
32 bit
Interface Type
RS-232
For Use With/related Products
MPC555
Lead Free Status / RoHS Status
Contains lead / RoHS non-compliant


21.2.4.2 Detecting the Trace Window Start Address
MPC555
USER’S MANUAL
ternal event of the CPU, it is possible to use the internal breakpoints together with de-
bug mode. This method is available only when debug mode is enabled. For more
information on debug mode refer to
The following is an example of steps that enable the user to synchronize the trace win-
dow to the CPU internal events:
When using back trace, latching the value of the status pins (VF and VFLS), and the
address of the cycles marked as program trace cycle, should start immediately after
the negation of reset. The start address is the first address in the program trace cycle
buffer.
When using window trace, latching the value of the status pins (VF and VFLS), and
the address of the cycles marked as program trace cycle, should start immediately af-
ter the first VSYNC is reported on the VF pins. The start address of the trace window
should be calculated according to first two VF pins reports.
Assuming that VF1 and VF2 are the two first VF pins reports and T1 and T2 are the
two addresses of the first two cycles marked with the program trace cycle attribute that
were latched in the trace buffer, use the following table to calculate the trace window
start address.
10. The hardware generates a breakpoint when the programmed event is detected
11. Negate VSYNC
12. Return to the regular code run (issue an rfi). The first report on the VF pins is a
13. The external hardware stops sampling the program trace information upon the
1. Enter debug mode, either immediately out of reset or using the debug mode re-
2. Program the hardware to break on the event that marks the start of the trace
3. Enable debug mode entry for the programmed breakpoint in the debug enable
4. Return to the regular code run (see
5. The hardware generates a breakpoint when the programmed event is detected
6. Program the hardware to break on the event that marks the end of the trace
7. Assert VSYNC
8. Return to the regular code run. The first report on the VF pins is a VSYNC (VF
9. The external hardware starts sampling the program trace information upon the
/
MPC556
quest
window using the control registers defined in
points Support
register (DER). See
and the machine enters debug mode (see
window
= 011).
report on the VF pins of VSYNC
and the machine enters debug mode
VSYNC (VF = 011)
report on the VF pins of VSYNC
21.7.12 Debug Enable Register
DEVELOPMENT SUPPORT
Rev. 15 October 2000
21.4 Development System Interface
21.4.1.6 Exiting Debug
21.4.1.2 Entering Debug
21.3 Watchpoints and Break-
(DER))
Mode)
MOTOROLA
Mode)
21-6
Related parts for MPC555CME
Image
Part Number
Description
Manufacturer
Datasheet
Request
R

Part Number:
Description:
MPC555 Interrupts
Manufacturer:
Freescale Semiconductor / Motorola
Datasheet:

Part Number:
Description:
Manufacturer:
Freescale Semiconductor, Inc
Datasheet:
Part Number:
Description:
Manufacturer:
Freescale Semiconductor, Inc
Datasheet:
Part Number:
Description:
Manufacturer:
Freescale Semiconductor, Inc
Datasheet:
Part Number:
Description:
Manufacturer:
Freescale Semiconductor, Inc
Datasheet:
Part Number:
Description:
Manufacturer:
Freescale Semiconductor, Inc
Datasheet:
Part Number:
Description:
Manufacturer:
Freescale Semiconductor, Inc
Datasheet:
Part Number:
Description:
Manufacturer:
Freescale Semiconductor, Inc
Datasheet:
Part Number:
Description:
Manufacturer:
Freescale Semiconductor, Inc
Datasheet:
Part Number:
Description:
Manufacturer:
Freescale Semiconductor, Inc
Datasheet:
Part Number:
Description:
Manufacturer:
Freescale Semiconductor, Inc
Datasheet:
Part Number:
Description:
Manufacturer:
Freescale Semiconductor, Inc
Datasheet:
Part Number:
Description:
Manufacturer:
Freescale Semiconductor, Inc
Datasheet:
Part Number:
Description:
Manufacturer:
Freescale Semiconductor, Inc
Datasheet:
Part Number:
Description:
Manufacturer:
Freescale Semiconductor, Inc
Datasheet: