8.10.00 J-TRACE ARM Segger Microcontroller Systems, 8.10.00 J-TRACE ARM Datasheet - Page 105
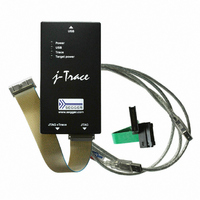
8.10.00 J-TRACE ARM
Manufacturer Part Number
8.10.00 J-TRACE ARM
Description
JTAG EMULATOR ARM7/ARM9 ETM
Manufacturer
Segger Microcontroller Systems
Type
Emulatorr
Specifications of 8.10.00 J-TRACE ARM
Contents
Emulation Module
For Use With/related Products
ARM7, ARM9
Lead Free Status / RoHS Status
Lead free / RoHS Compliant
Other names
899-1006


5.5
5.5.1
J-Link / J-Trace (UM08001)
J-Link / J-Trace is able to debug multiple cores on one target system connected to the
same scan chain. Configuring and using this feature is described in this section.
Multi-core debugging requires multiple debuggers or multiple instances of the same
debugger. Two or more debuggers can use the same J-Link / J-Trace simultaneously.
Configuring a debugger to work with a core in a multi-core environment does not
require special settings. All that is required is proper setup of the scan chain for each
debugger. This enables J-Link / J-Trace to debug more than one core on a target at
the same time.
The following figure shows a host, debugging two ARM cores with two instances of
the same debugger.
Both debuggers share the same physical connection. The core to debug is selected
through the JTAG-settings as described below.
Multi-core debugging
How multi-core debugging works
Debugger
ARM1
Instance 1
Target hardware
Host (PC)
J-Link
JTAG
USB
© 2004-2011 SEGGER Microcontroller GmbH & Co. KG
Debugger
Instance 2
ARM2
105
Related parts for 8.10.00 J-TRACE ARM
Image
Part Number
Description
Manufacturer
Datasheet
Request
R

Part Number:
Description:
CONNECTOR JTAG-ARM ISOLATION
Manufacturer:
Segger Microcontroller Systems
Datasheet:

Part Number:
Description:
ADAPTER ARM TARGET 14PIN RIBBON
Manufacturer:
Segger Microcontroller Systems
Datasheet:

Part Number:
Description:
JTAG EMULATOR FOR ARM CORES
Manufacturer:
Segger Microcontroller Systems
Datasheet:

Part Number:
Description:
JTAG EMULATOR FOR ARM CORES
Manufacturer:
Segger Microcontroller Systems
Datasheet:

Part Number:
Description:
PROGRAMMING TOOL FOR MCU
Manufacturer:
Segger Microcontroller Systems
Datasheet:

Part Number:
Description:
PROGRAMMING TOOL FOR ST7 MCU
Manufacturer:
Segger Microcontroller Systems
Datasheet:

Part Number:
Description:
PROGRAMMING TOOL FOR STM8
Manufacturer:
Segger Microcontroller Systems
Datasheet:

Part Number:
Description:
PROGRAMMER JTAG FOR ARM CORES
Manufacturer:
Segger Microcontroller Systems
Datasheet:

Part Number:
Description:
JTAG EMULATOR USB ETHERNET ARM
Manufacturer:
Segger Microcontroller Systems
Datasheet:

Part Number:
Description:
EMULATOR JTAG/SWD CORTEX M3
Manufacturer:
Segger Microcontroller Systems
Datasheet: