Z16F2800100ZCOG Zilog, Z16F2800100ZCOG Datasheet - Page 325
Z16F2800100ZCOG
Manufacturer Part Number
Z16F2800100ZCOG
Description
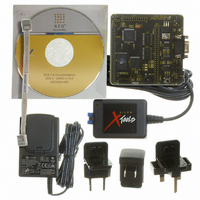
DEV KIT FOR Z16F ZNEO
Manufacturer
Zilog
Series
ZNEO™r
Type
MCUr
Datasheets
1.Z16F2800100ZCOG.pdf
(2 pages)
2.Z16F2800100ZCOG.pdf
(30 pages)
3.Z16F2800100ZCOG.pdf
(388 pages)
Specifications of Z16F2800100ZCOG
Contents
Evaluation Board, Software and Documentation
For Use With/related Products
Z16F Series
For Use With
269-4661 - KIT ACC ETHERNET SMART CABLE
Lead Free Status / RoHS Status
Lead free / RoHS Compliant
Other names
269-4537


®
ZNEO
Z16F Series
Product Specification
309
Trace Events
A trace event occurs anytime a CALL, RET, Interrupt, IRET, TRAP, JP, DJNZ, or Excep-
tion occurs. Trace takes four cycles each time a trace event occurs (five cycles for IRQ,
TRAP, and Exceptions).
Trace Buffer
The Trace Buffer is controlled by two registers: Trace Control (TRACECTL) and Trace
Address (TRACEADDR) register. The TRACECTL register is used to enable the trace
and select the size of the Trace Buffer. TRACEADDR selects the starting address for the
trace. The trace address is modulo-n based upon the size of the TRACESEL field in the
TRACECTL register. The modulo-n is zero aligned, which means that the trace buffer
always wraps to zero for the selected size. For example, if the TRACEADDR is set to
FFFFB050H and the TRACECTL is set to 81H, the Buffer is located from FFFFB000H to
FFFFB0FFH with the first trace event to be written to FFFFB050H. When the address
reaches FFFFB0FFH it will roll over to FFFFB000H.
Trace buffer sizes are 128, 256, 512, 1024, 2048, 4096, 8192, and 16384 bytes. Each trace
event requires eight bytes giving a minimum of 16 events to a maximum of 2048 events.
Only the Program Counter values are stored. Other information has to be inferred from the
source code by the trace debugger.
Trace Operation
On each trace event the current program counter is placed in memory pointed to by the
TRACEADDR. TRACEADDR increments by 4 and the next state of the program counter
is written to the TRACEADDR. TRACEADDR increments by 4 again. TRACEADDR
always points to the next data to be written. The lower two bits of the TRACEADDR are
always zero.
Extracting Trace Information
The trace information is extracted by reading the data from the selected trace memory
area. The data is then interpreted by the Trace Debugger software.
PS022008-0810
P R E L I M I N A R Y
On-Chip Debugger
Related parts for Z16F2800100ZCOG
Image
Part Number
Description
Manufacturer
Datasheet
Request
R

Part Number:
Description:
Communication Controllers, ZILOG INTELLIGENT PERIPHERAL CONTROLLER (ZIP)
Manufacturer:
Zilog, Inc.
Datasheet:

Part Number:
Description:
KIT DEV FOR Z8 ENCORE 16K TO 64K
Manufacturer:
Zilog
Datasheet:

Part Number:
Description:
KIT DEV Z8 ENCORE XP 28-PIN
Manufacturer:
Zilog
Datasheet:

Part Number:
Description:
DEV KIT FOR Z8 ENCORE 8K/4K
Manufacturer:
Zilog
Datasheet:

Part Number:
Description:
KIT DEV Z8 ENCORE XP 28-PIN
Manufacturer:
Zilog
Datasheet:

Part Number:
Description:
DEV KIT FOR Z8 ENCORE 4K TO 8K
Manufacturer:
Zilog
Datasheet:
Part Number:
Description:
CMOS Z8 microcontroller. ROM 16 Kbytes, RAM 256 bytes, speed 16 MHz, 32 lines I/O, 3.0V to 5.5V
Manufacturer:
Zilog, Inc.
Datasheet:
Part Number:
Description:
Low-cost microcontroller. 512 bytes ROM, 61 bytes RAM, 8 MHz
Manufacturer:
Zilog, Inc.
Datasheet:
Part Number:
Description:
Z8 4K OTP Microcontroller
Manufacturer:
Zilog, Inc.
Datasheet:
Part Number:
Description:
CMOS SUPER8 ROMLESS MCU
Manufacturer:
Zilog, Inc.
Datasheet:
Part Number:
Description:
SL1866 CMOSZ8 OTP Microcontroller
Manufacturer:
Zilog, Inc.
Datasheet:
Part Number:
Description:
SL1866 CMOSZ8 OTP Microcontroller
Manufacturer:
Zilog, Inc.
Datasheet:
Part Number:
Description:
OTP (KB) = 1, RAM = 125, Speed = 12, I/O = 14, 8-bit Timers = 2, Comm Interfaces Other Features = Por, LV Protect, Voltage = 4.5-5.5V
Manufacturer:
Zilog, Inc.
Datasheet:
Part Number:
Description:
Manufacturer:
Zilog, Inc.
Datasheet: