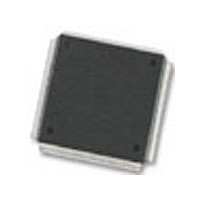
MC68376BAMFT20 Freescale Semiconductor, MC68376BAMFT20 Datasheet - Page 70

MC68376BAMFT20
Manufacturer Part Number
MC68376BAMFT20
Description
Manufacturer
Freescale Semiconductor
Datasheet
1.MC68376BAMFT20.pdf
(434 pages)
Specifications of MC68376BAMFT20
Cpu Family
68K/M683xx
Device Core
ColdFire
Device Core Size
32b
Frequency (max)
20MHz
Interface Type
QSPI/SCI
Program Memory Type
ROM
Program Memory Size
8KB
Total Internal Ram Size
7.5KB
# I/os (max)
18
Number Of Timers - General Purpose
2
Operating Supply Voltage (typ)
5V
Operating Supply Voltage (max)
5.25V
Operating Supply Voltage (min)
4.75V
On-chip Adc
16-chx10-bit
Instruction Set Architecture
RISC
Operating Temp Range
-40C to 125C
Operating Temperature Classification
Automotive
Mounting
Surface Mount
Pin Count
160
Package Type
PQFP
Lead Free Status / Rohs Status
Not Compliant
Available stocks
Company
Part Number
Manufacturer
Quantity
Price
Company:
Part Number:
MC68376BAMFT20
Manufacturer:
FREESCAL
Quantity:
245
- Current page: 70 of 434
- Download datasheet (7Mb)
4.10.1 M68000 Family Development Support
4.10.2 Background Debug Mode
4-18
MOTOROLA
All M68000 Family members include features to facilitate applications development.
These features include the following:
Trace on Instruction Execution — M68000 Family processors include an instruction-
by-instruction tracing facility as an aid to program development. The MC68020,
MC68030, MC68040, and CPU32 also allow tracing only of those instructions causing
a change in program flow. In the trace mode, a trace exception is generated after an
instruction is executed, allowing a debugger program to monitor the execution of a pro-
gram under test.
Breakpoint Instruction — An emulator may insert software breakpoints into the target
code to indicate when a breakpoint has occurred. On the MC68010, MC68020,
MC68030, and CPU32, this function is provided via illegal instructions, $4848–$484F,
to serve as breakpoint instructions.
Unimplemented Instruction Emulation — During instruction execution, when an at-
tempt is made to execute an illegal instruction, an illegal instruction exception occurs.
Unimplemented instructions (F-line, A-line, . . .) utilize separate exception vectors to
permit efficient emulation of unimplemented instructions in software.
Microcomputer systems generally provide a debugger, implemented in software, for
system analysis at the lowest level. The background debug mode (BDM) on the
CPU32 is unique in that the debugger has been implemented in CPU microcode.
BDM incorporates a full set of debugging options: registers can be viewed or altered,
memory can be read or written to, and test features can be invoked.
A resident debugger simplifies implementation of an in-circuit emulator. In a common
setup (refer to Figure 4-8), emulator hardware replaces the target system processor.
A complex, expensive pod-and-cable interface provides a communication path be-
tween the target system and the emulator.
By contrast, an integrated debugger supports use of a bus state analyzer (BSA) for
incircuit emulation. The processor remains in the target system (refer to Figure 4-9)
and the interface is simplified. The BSA monitors target processor operation and the
on-chip debugger controls the operating environment. Emulation is much “closer” to
target hardware, and many interfacing problems (for example, limitations on high-
frequency operation, AC and DC parametric mismatches, and restrictions on cable
length) are minimized.
CENTRAL PROCESSOR UNIT
USER’S MANUAL
MC68336/376
Related parts for MC68376BAMFT20
Image
Part Number
Description
Manufacturer
Datasheet
Request
R
Part Number:
Description:
Manufacturer:
Freescale Semiconductor, Inc
Datasheet:
Part Number:
Description:
Manufacturer:
Freescale Semiconductor, Inc
Datasheet:
Part Number:
Description:
Manufacturer:
Freescale Semiconductor, Inc
Datasheet:
Part Number:
Description:
Manufacturer:
Freescale Semiconductor, Inc
Datasheet:
Part Number:
Description:
Manufacturer:
Freescale Semiconductor, Inc
Datasheet:
Part Number:
Description:
Manufacturer:
Freescale Semiconductor, Inc
Datasheet:
Part Number:
Description:
Manufacturer:
Freescale Semiconductor, Inc
Datasheet:
Part Number:
Description:
Manufacturer:
Freescale Semiconductor, Inc
Datasheet:
Part Number:
Description:
Manufacturer:
Freescale Semiconductor, Inc
Datasheet:
Part Number:
Description:
Manufacturer:
Freescale Semiconductor, Inc
Datasheet:
Part Number:
Description:
Manufacturer:
Freescale Semiconductor, Inc
Datasheet:
Part Number:
Description:
Manufacturer:
Freescale Semiconductor, Inc
Datasheet:
Part Number:
Description:
Manufacturer:
Freescale Semiconductor, Inc
Datasheet:
Part Number:
Description:
Manufacturer:
Freescale Semiconductor, Inc
Datasheet:
Part Number:
Description:
Manufacturer:
Freescale Semiconductor, Inc
Datasheet:


