CDK5560 Cirrus Logic Inc, CDK5560 Datasheet - Page 19
CDK5560
Manufacturer Part Number
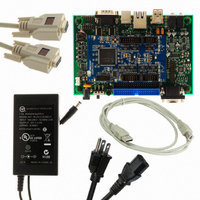
CDK5560
Description
KIT - CDB5560 W/ Capture Plus II System
Manufacturer
Cirrus Logic Inc
Series
CapturePLUS™IIr
Specifications of CDK5560
Number Of Adc's
1
Number Of Bits
24
Sampling Rate (per Second)
50k
Data Interface
Serial
Inputs Per Adc
1 Differential
Input Range
±3 V
Power (typ) @ Conditions
90mW @ 2.5 V
Voltage Supply Source
Dual ±
Operating Temperature
-40°C ~ 85°C
Utilized Ic / Part
CS5560
Lead Free Status / RoHS Status
Contains lead / RoHS non-compliant
Other names
598-1277
CDK5560-1
CDK5560-1


4.2.7
The Histogram tab displays the data set using statistical analysis. Select the Histogram tab to display this
panel. Click on any other tab to exit this panel.
The Histogram tab consists of the following controls:
DS789UM2
– Analyze: After acquiring one or more data sets the Software will pause and wait for the Analyze
– Data Graph: The Data Graph provides a histogram distribution of the data set.
– Mean: The mean statistical measurement is in units of volts or LSBs (least significant bits). The
– Standard Dev: The standard deviation statistical measurement is in units of volts or LSBs (least
button to be activated. Click on the Analyze button to analyze the data set and display the results.
Only the last data set acquired is analyzed.
mean statistical measurement units are set by the Magnitude Display button in the General
Configuration menu.
significant bits). The standard deviation statistical measurement units are set by the Magnitude
Display button in the General Configuration menu. If the units are volts, the standard deviation
represents volts RMS.
X-axis: Plots the reading (bits or volts). The x-axis index units are selected by the Magnitude
Display button within the Configuration panel.
Y-axis: Plots occurrences: The y-axis indicates the number of times a particular value occurred.
ADC Values: This menu provides data set graphing options. Click on the ADC Values menu to
activate it.
Graph Zoom: This menu provides graph zoom options. Click on the Graph Zoom buttons to
access the zoom functions. Also, the x-axis and y-axis scaling can be changed by clicking on
the minimum or maximum index numbers and manually entering a new value.
Histogram Tab
CapturePlus II
19
Related parts for CDK5560
Image
Part Number
Description
Manufacturer
Datasheet
Request
R

Part Number:
Description:
Development Kit
Manufacturer:
Cirrus Logic Inc
Datasheet:
Part Number:
Description:
Development Kit
Manufacturer:
Cirrus Logic Inc
Datasheet:


Part Number:
Description:
High-efficiency PFC + Fluorescent Lamp Driver Reference Design
Manufacturer:
Cirrus Logic Inc
Datasheet:
Part Number:
Description:
Development Kit
Manufacturer:
Cirrus Logic Inc
Datasheet:
Part Number:
Description:
Development Kit
Manufacturer:
Cirrus Logic Inc
Datasheet:

Part Number:
Description:
Development Kit
Manufacturer:
Cirrus Logic Inc
Datasheet:
Part Number:
Description:
Development Kit
Manufacturer:
Cirrus Logic Inc
Datasheet:
Part Number:
Description:
Development Kit
Manufacturer:
Cirrus Logic Inc
Datasheet:
Part Number:
Description:
Development Kit
Manufacturer:
Cirrus Logic Inc
Datasheet:

Part Number:
Description:
EVALUATION BOARD FOR CS8427
Manufacturer:
Cirrus Logic Inc
Datasheet:

Part Number:
Description:
BOARD EVAL FOR CS8416 RCVR
Manufacturer:
Cirrus Logic Inc
Datasheet:

Part Number:
Description:
EVALUATION BOARD FOR CS8420
Manufacturer:
Cirrus Logic Inc
Datasheet:

Part Number:
Description:
KIT DEVELOPMENT EP9315 ARM9
Manufacturer:
Cirrus Logic Inc
Datasheet:

Part Number:
Description:
KIT DEVELOPMENT EP9302 ARM9
Manufacturer:
Cirrus Logic Inc
Datasheet: