CDK5560 Cirrus Logic Inc, CDK5560 Datasheet - Page 18
CDK5560
Manufacturer Part Number
CDK5560
Description
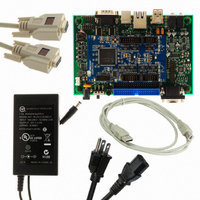
KIT - CDB5560 W/ Capture Plus II System
Manufacturer
Cirrus Logic Inc
Series
CapturePLUS™IIr
Specifications of CDK5560
Number Of Adc's
1
Number Of Bits
24
Sampling Rate (per Second)
50k
Data Interface
Serial
Inputs Per Adc
1 Differential
Input Range
±3 V
Power (typ) @ Conditions
90mW @ 2.5 V
Voltage Supply Source
Dual ±
Operating Temperature
-40°C ~ 85°C
Utilized Ic / Part
CS5560
Lead Free Status / RoHS Status
Contains lead / RoHS non-compliant
Other names
598-1277
CDK5560-1
CDK5560-1


18
– Grounded Input FFT: Click on this button to change the voltage reference value used to calculate
– Linear / Log Freq Scaling: Click on this button to change the data graph x-axis scaling between
– Frequency @ Max Magnitude: The frequency value displayed is the input signal's fundamental
– Magnitude: The magnitude value displayed is the input signal's magnitude as observed in the data
– FFT Bin Count: The bin count value displayed is the number of bins used to generate the FFT. The
– S/PN(SFDR): Signal-to-peak noise (spurious free dynamic range). Measurement provides
– SINAD: Signal-to-Noise and distortion. Measurement provides SINAD data for the present data set
– S/D: Signal-to-Distortion. Measurement provides S/D data for the present data set and is in units of
– SNR: Signal-to-noise ratio. Measurement provides SNR data for the present data set and is in units
– Analyze FFT: After acquiring a single data set the software will pause and wait for the Analyze FFT
– Cursors: The Cursors sub-panel displays the frequency and magnitude value of the fundamental
attenuation of 125 dB.
Crystal 7 Term: The Hodie 5 Term Windowing Function is a proprietary 7-term digital filter optimized
for examining an FFT with spectral content. It has a processing loss of 4.203dB and side lobe
attenuation of 175dB.
the dynamic performance values. When the button is a light green color, the performance
calculations are for a grounded input FFT and an artificially generated 0 dBFS signal number
(equivalent to a full-scale input voltage) is used to calculate noise and distortion. When the button is
a dark green color, the externally applied analog input signal peak amplitude displayed in the FFT is
the reference voltage used to calculate noise and distortion.
linear and logarithmic. When the button is a dark green color, the data graph x-axis scaling will be
linear. When the button is a light green color, the data graph x-axis scaling will be logarithmic.
frequency as observed in the data graph (highest amplitude peak).
graph. The magnitude value displayed will include the windowing loss value given in the Window
Type description. Calculate the actual signal peak by adding the window loss to the magnitude value.
bin count is one-half the data set sample size.
S/PN(SFDR) for the present data set and is in units of dBFS (voltage ratio). Measurement references
either the analog input signal magnitude (if the Grounded Input FFT switch is disabled) or 0 dBFS (if
the Grounded Input FFT switch is enabled and bright green).
and is in units of dBFS (voltage ratio). The SINAD calculation's signal variable uses either the analog
input signal magnitude (if the Grounded Input FFT switch is disabled) or 0 dBFS (if the Grounded
Input FFT switch is enabled and bright green).
dBFS (volts). The S/D calculation's signal variable uses the analog input signal magnitude (Grounded
Input FFT switch is disabled).
of dBFS (volts). The SNR calculation's signal variable uses either the analog input signal magnitude
(if the Grounded Input FFT switch is disabled and dark green) or 0 dBFS (if the Grounded Input FFT
switch is enabled and bright green).
button to be activated before performing the analysis and displaying the results. Likewise, to update
the data graph after making changes to the Window Type, Grounded Input FFT, or Linear / Log Freq
Scaling controls, activate the Analyze FFT button. Alternately, when averaging multiple contiguous
data sets the software will automatically perform the analysis and display the results.
frequency and the 2
frequency and magnitude values for the user-controlled cursor. The cursor magnitude values are
referenced to 0 dBFS.
nd
to 5
th
harmonic frequencies as determined by the software. It also displays the
CapturePlus II
DS789UM2
Related parts for CDK5560
Image
Part Number
Description
Manufacturer
Datasheet
Request
R

Part Number:
Description:
Development Kit
Manufacturer:
Cirrus Logic Inc
Datasheet:
Part Number:
Description:
Development Kit
Manufacturer:
Cirrus Logic Inc
Datasheet:


Part Number:
Description:
High-efficiency PFC + Fluorescent Lamp Driver Reference Design
Manufacturer:
Cirrus Logic Inc
Datasheet:
Part Number:
Description:
Development Kit
Manufacturer:
Cirrus Logic Inc
Datasheet:
Part Number:
Description:
Development Kit
Manufacturer:
Cirrus Logic Inc
Datasheet:

Part Number:
Description:
Development Kit
Manufacturer:
Cirrus Logic Inc
Datasheet:
Part Number:
Description:
Development Kit
Manufacturer:
Cirrus Logic Inc
Datasheet:
Part Number:
Description:
Development Kit
Manufacturer:
Cirrus Logic Inc
Datasheet:
Part Number:
Description:
Development Kit
Manufacturer:
Cirrus Logic Inc
Datasheet:

Part Number:
Description:
EVALUATION BOARD FOR CS8427
Manufacturer:
Cirrus Logic Inc
Datasheet:

Part Number:
Description:
BOARD EVAL FOR CS8416 RCVR
Manufacturer:
Cirrus Logic Inc
Datasheet:

Part Number:
Description:
EVALUATION BOARD FOR CS8420
Manufacturer:
Cirrus Logic Inc
Datasheet:

Part Number:
Description:
KIT DEVELOPMENT EP9315 ARM9
Manufacturer:
Cirrus Logic Inc
Datasheet:

Part Number:
Description:
KIT DEVELOPMENT EP9302 ARM9
Manufacturer:
Cirrus Logic Inc
Datasheet: