CDK5560 Cirrus Logic Inc, CDK5560 Datasheet - Page 17
CDK5560
Manufacturer Part Number
CDK5560
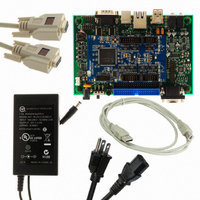
Description
KIT - CDB5560 W/ Capture Plus II System
Manufacturer
Cirrus Logic Inc
Series
CapturePLUS™IIr
Specifications of CDK5560
Number Of Adc's
1
Number Of Bits
24
Sampling Rate (per Second)
50k
Data Interface
Serial
Inputs Per Adc
1 Differential
Input Range
±3 V
Power (typ) @ Conditions
90mW @ 2.5 V
Voltage Supply Source
Dual ±
Operating Temperature
-40°C ~ 85°C
Utilized Ic / Part
CS5560
Lead Free Status / RoHS Status
Contains lead / RoHS non-compliant
Other names
598-1277
CDK5560-1
CDK5560-1


4.2.6
The Frequency Domain tab displays the data set in the frequency domain. Select the Frequency Domain
tab to display this panel. Click on any other tab to exit this panel.
The Frequency Domain tab consists of the following controls:
DS789UM2
– Data Graph: The Data Graph provides an x-y plot of the data set in the frequency domain.
– Window Type: Change the FFT windowing function by activating the Window Type Up / Down
buttons. Display the current data set using the selected windowing function by clicking the Analyze
FFT button.
Three windowing functions are available:
noise. It is used primarily for examining the noise floor produced by a Grounded Input FFT without
any input signal.
Hodie 5 Term: The Hodie 5 Term Windowing Function is a proprietary 5-term digital filter optimized
for examining an FFT with spectral content. It has a processing loss of 3.457 dB and side lobe
Rectangular: The Rectangular Windowing Function is optimized for measuring FFT broad band
X-axis: Plots Frequency in Hertz. The x-axis index is in units of Hertz for the FFT frequency bins.
Bin size is based upon the ADC data sample rate.
Y-axis: plots voltage magnitude (dBFS). The y-axis provides an index in units of Voltage dBFS for
the voltage magnitude of a given FFT frequency bin.
ADC Values: This menu provides data set graphing options. Click on the ADC Values icon to open
the ADC Values menu.
Graph Zoom: The Graph Zoom functions are available at the bottom right corner of the graph.
Also, the Minimum and Maximum x-axis and y-axis index numbers can be manually changed by
applying a clicking on the minimum and maximum index numbers and entering a new value.
Frequency Domain Tab
CapturePlus II
17
Related parts for CDK5560
Image
Part Number
Description
Manufacturer
Datasheet
Request
R

Part Number:
Description:
Development Kit
Manufacturer:
Cirrus Logic Inc
Datasheet:
Part Number:
Description:
Development Kit
Manufacturer:
Cirrus Logic Inc
Datasheet:


Part Number:
Description:
High-efficiency PFC + Fluorescent Lamp Driver Reference Design
Manufacturer:
Cirrus Logic Inc
Datasheet:
Part Number:
Description:
Development Kit
Manufacturer:
Cirrus Logic Inc
Datasheet:
Part Number:
Description:
Development Kit
Manufacturer:
Cirrus Logic Inc
Datasheet:

Part Number:
Description:
Development Kit
Manufacturer:
Cirrus Logic Inc
Datasheet:
Part Number:
Description:
Development Kit
Manufacturer:
Cirrus Logic Inc
Datasheet:
Part Number:
Description:
Development Kit
Manufacturer:
Cirrus Logic Inc
Datasheet:
Part Number:
Description:
Development Kit
Manufacturer:
Cirrus Logic Inc
Datasheet:

Part Number:
Description:
EVALUATION BOARD FOR CS8427
Manufacturer:
Cirrus Logic Inc
Datasheet:

Part Number:
Description:
BOARD EVAL FOR CS8416 RCVR
Manufacturer:
Cirrus Logic Inc
Datasheet:

Part Number:
Description:
EVALUATION BOARD FOR CS8420
Manufacturer:
Cirrus Logic Inc
Datasheet:

Part Number:
Description:
KIT DEVELOPMENT EP9315 ARM9
Manufacturer:
Cirrus Logic Inc
Datasheet:

Part Number:
Description:
KIT DEVELOPMENT EP9302 ARM9
Manufacturer:
Cirrus Logic Inc
Datasheet: