CDK5560 Cirrus Logic Inc, CDK5560 Datasheet
CDK5560
Specifications of CDK5560
CDK5560-1


Related parts for CDK5560


CDK5560 Summary of contents
Page 1
High-speed Data Acquisition System Features High-speed Data Acquisition & Analysis Tool Acquisition System Greatly Simplifies Capturing Data from Cirrus Logic Industrial Evaluation Boards ® LabVIEW -based Data Capture Software Real-time Data Capture – Save Data Captures for Later Analysis Frequency ...
Page 2
CAPTUREPLUS II HARDWARE OVERVIEW .......................................................................... 3 1.1 Kit Contents ....................................................................................................................... 3 1.2 Required Items Not Supplied ............................................................................................. 3 1.3 Minimum PC System Requirements .................................................................................. 3 2. SOFTWARE SETUP ................................................................................................................. 4 3. HARDWARE SETUP ................................................................................................................ 5 4. SOFTWARE DESCRIPTION .................................................................................................... ...
Page 3
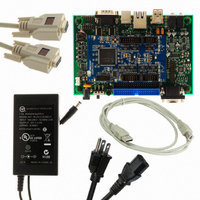
CAPTUREPLUS II HARDWARE OVERVIEW Board A (ARM9) Indicator LEDs USB Driver Ethernet Driver 1.1 Kit Contents The following items are included in the CapturePlus II kit. – Cirrus Logic ARM9-based Control/Communications Board – CapturePlus II Data Acquisition Software on ...
Page 4
SOFTWARE SETUP The following section assumes the software is being installed from the CD-ROM included in the kit. The complete software install package and any software updates can be downloaded from www.cirrus.com/Industrialsoftware. 1. Insert the CapturePlus II CDROM into ...
Page 5
HARDWARE SETUP The following section describes the connections between the Cirrus Logic evaluation board and the Cap- turePlus II system. It then describes the connections between the CapturePlus II system and the PC. Cirrus Logic Evaluation Board ADC & ...
Page 6
SOFTWARE DESCRIPTION The CapturePlus II Software user interface is divided into two sections: – The data control sub-panels are located on the left-hand side and bottom of the GUI display and are always available. – The tabs at the ...
Page 7
Device Sub-panel The Device sub-panel configures the CapturePlus II system to capture data from the evaluation board. This sub-panel is always available. Sub-panel Descriptions: – Pull-down menu: The pull-down menu selects the Cirrus Logic evaluation board and associated device. ...
Page 8
Timed Conversion or Continuous Conversion: Click on the toggle switch to change between Timed Conversion and Continuous Conversion modes. In Timed Conversion mode the CapturePlus II system forces the Desired Sample Rate to be met by applying the correct ...
Page 9
View Sub-panel Use the View sub-panel to select the evaluation board analog input channel data set on which the soft- ware performs calculations and plots data graphs. This sub-panel is always available, however there may be only one channel’s ...
Page 10
Menu Tabs The menu tabs are always present at the top of the software panels and provide access to configuration and data collection panels. The menu tab selects the currently displayed panel. Sub-panel Descriptions: – Communication Configuration: Displays the ...
Page 11
Communication Configuration Tab The Communication Configuration panel establishes the communications link between the CapturePlus II system and the PC running the software. Select the Communication Configuration tab to display this panel. Click on any other tab to exit this ...
Page 12
USB Communications A USB communication link must be established between the PC and the CapturePlus II hardware before the CapturePlus II system can operate. To open communication to a USB connection perform the following steps: – Select an available USB ...
Page 13
General Configuration Tab The General Configuration tab provides access to configure the scaling for all software-generated data graphs and calculations. Click on any other tab to exit this panel. The General Configuration panel contains the following sub-panels: Scaling: Use ...
Page 14
ADC Configuration Tab The ADC Configuration tab provides a method for reading and writing to the ADC digital gain and offset registers. Select the ADC Configuration tab to display this panel. Click on any other tab to exit this ...
Page 15
Configuration Tab The Configuration tab provides access to configure the ADC and the data acquisition system. Click on any other tab to exit this panel. The Configuration panel contains the following sub-panels: – Sample Settings: Provides a switch for ...
Page 16
Time Domain Tab The Time Domain tab displays the data set in the time domain. Select the Time Domain tab to display this panel. Click on any other tab to exit this panel. The Time Domain tab consists of ...
Page 17
Frequency Domain Tab The Frequency Domain tab displays the data set in the frequency domain. Select the Frequency Domain tab to display this panel. Click on any other tab to exit this panel. The Frequency Domain tab consists of ...
Page 18
Crystal 7 Term: The Hodie 5 Term Windowing Function is a proprietary 7-term digital filter optimized for examining an FFT with spectral content. It has a processing loss of 4.203dB and side lobe attenuation of 175dB. ...
Page 19
Histogram Tab The Histogram tab displays the data set using statistical analysis. Select the Histogram tab to display this panel. Click on any other tab to exit this panel. The Histogram tab consists of the following controls: – Analyze: ...
Page 20
Variance: The variance statistical measurement is in units of volts The variance statistical measurement units are set by the Magnitude Display button in the General Configuration menu. – Minimum: The minimum statistical measurement is in units of volts or ...
Page 21
CONFIGURING THE CapturePlus II SYSTEM The following sections describe how to configure the CapturePlus II system. The CapturePlus II system is designed to interface with a wide variety of Cirrus Logic evaluation boards. For this example set-up, the instructions ...
Page 22
Click the Connect USB button to connect the communications port. When a communications port is con- figured and communicating, the Connect USB button will no longer be highlighted and the Connected in- dicator will change to a bright green color. ...
Page 23
Selecting the Cirrus Logic Evaluation Board Type In most cases the CapturePlus II system will automatically identify the evaluation board connected to the system. The software displays the selected evaluation board in the Device window. If the software De- ...
Page 24
APPENDIX A. TESTING THE CIRRUS LOGIC CDB556x/7x/8x EVALUATION BOARD The following sections describe several basic tests performed to establish basic system functionality and baseline noise and distortion levels. A.1 Baseline Testing for Noise & Distortion A.1.1 Baseline Noise & Distortion ...
Page 25
Activate the Acquire button. Within the Acquire sub-panel set Select Number of Samples to Capture to 524288. Start the test run by clicking OK. Run time for this test is less than 1 minute for a 100 kSps ADC. When ...
Page 26
A typical FFT plot resulting from running a baseline test is shown below. Key information calculated from the captured data and displayed is the SFDR, SINAD, S/D, and SNR. A.1.2 Baseline Noise & Distortion Test - Averaged FFT Connect the ...
Page 27
Activate the Acquire button. Within the Acquire sub-panel set Select Number of Samples to Capture to 524288. Click on Enable Averaged FFT. In this example, Averages have been set to 4. Start the test run by clicking OK. Run time ...
Page 28
A.1.3 Baseline Noise & Distortion Test - Time Domain Analysis Connect the evaluation board’s analog input(s) to circuit ground. Select the Time Domain window by clicking on the Time Domain tab at the top of the screen. Click on the ...
Page 29
Start the test run by clicking OK. Upon completing the data capture, the screen will automatically display the results. A typical time domain plot resulting from running a baseline test is shown below. Key infor- mation calculated from the captured ...
Page 30
A.1.4 Baseline Noise & Distortion Test - Histogram Analysis Connect the evaluation board’s analog input(s) to circuit ground. Select the Histogram window by clicking on the Histogram tab at the top of the screen. Click on the Acquire button. Within ...
Page 31
Start the test run by clicking OK. When the data has been captured and is ready to be displayed, the Status window at the bottom of the screen will display “Time Domain Analysis Complete”. Click on the Analyze button to ...
Page 32
A.2 Measuring Analog Input Signals A.2.1 Setting Up the Input Signal Amplitude Connect the signal source to the evaluation board analog input(s). Select the Time Domain window by clicking on the Time Domain tab at the top of the screen. ...
Page 33
Start the test run by clicking OK. At the end of the test run the screen will automatically display the results. A typical time domain plot from capturing a -0.5 dB input signal with a 24-bit ADC is shown below. ...
Page 34
A.2.2 Measuring a Single Analog Input Signal A test to determine the evaluation board performance with a full-scale input signal can be performed once the hardware and software are configured. The following describes testing of the system using a typical ...
Page 35
Click on the Acquire button. Within the Acquire sub-panel, set Select Number of Samples to Capture to 524288. Click on Enable Averaged FFT. In this example, Averages have been set to 4. Start the test run by clicking OK. Run ...
Page 36
A.2.3 Measuring Multiplexed Analog Input Signals The following section demonstrates how testing the evaluation board performance with full-scale, multi- plexed input signals is performed once the hardware and software are configured. Connect a 1 kHz, -0.5 dB signal to one ...
Page 37
Click the Acquire button. Within the Acquire sub-panel, set Select Number of Samples to Capture to 524288. Click on Enable Averaged FFT. In this example, and Channels to Sample have been set to All. Start the test run by clicking ...
Page 38
Key information calculated from the captured data and displayed is the SFDR, SINAD, S/D, and SNR. Notice that when running an averaged, multiple FFT test the user is not required to activate the Analyze FFT button to display the FFT ...
Page 39
APPENDIX B. RECOMMENDATIONS FOR MAXIMUM PERFORMANCE The following are some general recommendations for maximizing the performance of Cirrus Logic evalu- ation systems. – When applying power to the evaluation board, use power supplies isolated from utility AC line and ground. ...
Page 40
APPENDIX C. FFT WINDOW LEAKAGE Windowing functions which are used to make FFT (Fast Fourier Transform) plots more informative also generate a measurable error by spreading energy from the FFT signal peaks to the surrounding noise floor. This results from ...
Page 41
DS789UM2 NOTES CapturePlus II 41 ...
Page 42
Contacting Cirrus Logic Support For all product questions and inquiries contact a Cirrus Logic Sales Representative. To find the one nearest to you go to www.cirrus.com IMPORTANT NOTICE Cirrus Logic, Inc. and its subsidiaries ("Cirrus") believe that the information contained ...