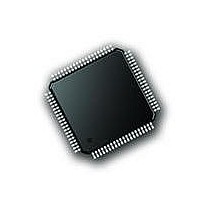
PIC18F87J72-I/PT Microchip Technology, PIC18F87J72-I/PT Datasheet - Page 440

PIC18F87J72-I/PT
Manufacturer Part Number
PIC18F87J72-I/PT
Description
IC PIC MCU 8BIT 14KB FLSH 80TQFP
Manufacturer
Microchip Technology
Series
PIC® 18Fr
Datasheet
1.PIC18F86J72-IPT.pdf
(480 pages)
Specifications of PIC18F87J72-I/PT
Program Memory Type
FLASH
Program Memory Size
128KB (64K x 16)
Package / Case
80-TQFP
Core Processor
PIC
Core Size
8-Bit
Speed
48MHz
Connectivity
I²C, LIN, SPI, UART/USART
Peripherals
Brown-out Detect/Reset, LCD, LVD, POR, PWM, WDT
Number Of I /o
51
Ram Size
3.8K x 8
Voltage - Supply (vcc/vdd)
2 V ~ 3.6 V
Data Converters
A/D 12x12b
Oscillator Type
Internal
Operating Temperature
-40°C ~ 85°C
Data Bus Width
8 bit
Data Ram Size
4 KB
Interface Type
SPI, USART, SPI, I2C
Maximum Clock Frequency
8 MHz
Number Of Programmable I/os
51
Number Of Timers
4
Operating Supply Voltage
2 V to 3.6 V
Maximum Operating Temperature
+ 85 C
Mounting Style
SMD/SMT
Minimum Operating Temperature
- 40 C
On-chip Adc
14
Controller Family/series
PIC18F
No. Of I/o's
51
Ram Memory Size
3923Byte
Cpu Speed
48MHz
No. Of Timers
4
Rohs Compliant
Yes
Lead Free Status / RoHS Status
Lead free / RoHS Compliant
Lead Free Status / RoHS Status
Lead free / RoHS Compliant, Lead free / RoHS Compliant
Available stocks
Company
Part Number
Manufacturer
Quantity
Price
Company:
Part Number:
PIC18F87J72-I/PT
Manufacturer:
Microchip
Quantity:
210
Company:
Part Number:
PIC18F87J72-I/PT
Manufacturer:
Microchip Technology
Quantity:
10 000
- Current page: 440 of 480
- Download datasheet (5Mb)
converting the THD to a percentage, here is the formula:
PIC18F87J72 FAMILY
EQUATION B-4:
B.3.10
The most important figure of merit for the analog
performance of the ADCs is the Signal-to-Noise and
Distortion (SINAD) specification.
Signal-to-noise and distortion ratio is similar to
signal-to-noise ratio, with the exception that you must
include the harmonics power in the noise power calcu-
lation. The SINAD specification depends mainly on the
OSR and DITHER settings.
EQUATION B-5:
The calculated combination of SNR and THD per the
following formula also yields SINAD:
EQUATION B-6:
B.3.11
The total harmonic distortion is the ratio of the output
harmonics power to the fundamental signal power for a
sine wave input and is defined by the following
equation.
EQUATION B-7:
The THD calculation includes the first 35 harmonics for
the AFE’s specifications. The THD is usually only
measured with respect to the first 10 harmonics. This
specification depends mainly on the DITHER setting.
THD is sometimes expressed in percentage. For
EQUATION B-8:
DS39979A-page 440
SINAD dB
THD dB
SINAD dB
SNR dB
SIGNAL-TO-NOISE RATIO AND
DISTORTION (SINAD)
TOTAL HARMONIC DISTORTION
(THD)
THD %
=
=
10
10
=
=
log
log
10
10
SIGNAL-TO-NOISE RATIO
SINAD EQUATION
SINAD, THD AND SNR
RELATIONSHIP
=
log
log
------------------------------------------------------------------- -
Noise
---------------------------------------------------- -
FundamentalPower
100 10
HarmonicsPower
SignalPower
--------------------------------- -
10
NoisePower
+
SignalPower
SNR
---------- -
10
HarmonicsPower
THD dB
------------------------
+
20
10
–
--------------- -
THD
10
Preliminary
B.3.12
The ratio between the output power of the fundamental
and the highest spur in the frequency spectrum. The
spur frequency is not necessarily a harmonic of the
fundamental even though it is usually the case. This
figure represents the dynamic range of the ADC when
a full-scale signal is used at the input. This specification
depends mainly on the DITHER setting.
EQUATION B-9:
B.3.13
A Delta-Sigma Converter is an integrating converter. It
also has a finite quantization step (LSB) which can be
detected by its quantizer. A DC input voltage that is
below the quantization step should only provide an all
zeros result, since the input is not large enough to be
detected. As an integrating device, any Delta-Sigma
will show, in this case, Idle tones. This means that the
output will have spurs in the frequency content that are
depending on the ratio between quantization step
voltage and the input voltage. These spurs are the
result of the integrated subquantization step inputs that
will eventually cross the quantization steps after a long
enough integration. This will induce an AC frequency at
the output of the ADC and can be shown in the ADC
output spectrum.
These Idle tones are residues that are inherent to the
quantization process and the fact that the converter is
integrating at all times without being reset. They are
residues of the finite resolution of the conversion
process. They are very difficult to attenuate and they
are heavily signal dependent. They can degrade both
SFDR and THD of the converter, even for DC inputs.
They can be localized in the baseband of the converter,
and thus, difficult to filter from the actual input signal.
For power metering applications, Idle tones can be very
disturbing because energy can be detected even at the
50 or 60 Hz frequency, depending on the DC offset of
the ADCs, while no power is really present at the
inputs. The only practical way to suppress or attenuate
Idle tones phenomenon is to apply dithering to the
ADC. The Idle tones amplitudes are a function of the
order of the modulator, the OSR and the number of
levels in the quantizer of the modulator. A higher order,
a higher OSR or a higher number of levels for the
quantizer will attenuate the Idle tones amplitude.
SFDR dB
SPURIOUS-FREE DYNAMIC RANGE
(SFDR)
IDLE TONES
=
10
log
2010 Microchip Technology Inc.
FundamentalPower
---------------------------------------------------- -
HighestSpurPower
Related parts for PIC18F87J72-I/PT
Image
Part Number
Description
Manufacturer
Datasheet
Request
R

Part Number:
Description:
Manufacturer:
Microchip Technology Inc.
Datasheet:

Part Number:
Description:
Manufacturer:
Microchip Technology Inc.
Datasheet:

Part Number:
Description:
Manufacturer:
Microchip Technology Inc.
Datasheet:

Part Number:
Description:
Manufacturer:
Microchip Technology Inc.
Datasheet:

Part Number:
Description:
Manufacturer:
Microchip Technology Inc.
Datasheet:

Part Number:
Description:
Manufacturer:
Microchip Technology Inc.
Datasheet:

Part Number:
Description:
Manufacturer:
Microchip Technology Inc.
Datasheet:

Part Number:
Description:
Manufacturer:
Microchip Technology Inc.
Datasheet:


