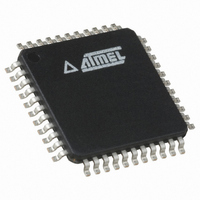
ATMEGA162V-8AJ Atmel, ATMEGA162V-8AJ Datasheet - Page 201

ATMEGA162V-8AJ
Manufacturer Part Number
ATMEGA162V-8AJ
Description
IC MCU AVR 16K 5V 8MHZ 44-TQFP
Manufacturer
Atmel
Series
AVR® ATmegar
Specifications of ATMEGA162V-8AJ
Core Processor
AVR
Core Size
8-Bit
Speed
8MHz
Connectivity
EBI/EMI, SPI, UART/USART
Peripherals
Brown-out Detect/Reset, POR, PWM, WDT
Number Of I /o
35
Program Memory Size
16KB (8K x 16)
Program Memory Type
FLASH
Eeprom Size
512 x 8
Ram Size
1K x 8
Voltage - Supply (vcc/vdd)
1.8 V ~ 5.5 V
Oscillator Type
Internal
Operating Temperature
-40°C ~ 85°C
Package / Case
44-TQFP, 44-VQFP
Lead Free Status / RoHS Status
Lead free / RoHS Compliant
Data Converters
-
Available stocks
Company
Part Number
Manufacturer
Quantity
Price
- Current page: 201 of 324
- Download datasheet (6Mb)
Using the On-chip
Debug system
2513K–AVR–07/09
As shown in
•
•
•
All read or modify/write operations needed for implementing the Debugger are done by applying
AVR instructions via the internal AVR CPU Scan Chain. The CPU sends the result to an I/O
memory mapped location which is part of the communication interface between the CPU and the
JTAG system.
The Break Point unit implements Break on Change of program flow, Single Step Break, two Pro-
gram memory Break Points, and two Combined Break Points. Together, the four Break Points
can be configured as either:
•
•
•
•
•
A debugger, like the AVR Studio
nal purpose, leaving less flexibility to the end-user.
A list of the On-chip Debug specific JTAG instructions is given in
instructions” on page
The JTAGEN Fuse must be programmed to enable the JTAG Test Access Port. In addition, the
OCDEN Fuse must be programmed and no Lock bits must be set for the On-chip debug system
to work. As a security feature, the On-chip debug system is disabled when either of the LB1 or
LB2 Lock bits are set. Otherwise, the On-chip debug system would have provided a backdoor
into a secured device.
The AVR Studio enables the user to fully control execution of programs on an AVR device with
On-chip Debug capability, AVR In-Circuit Emulator, or the built-in AVR Instruction Set Simulator.
AVR Studio supports source level execution of Assembly programs assembled with Atmel Cor-
poration’s AVR Assembler and C programs compiled with third party vendors’ compilers.
AVR Studio runs under Microsoft
For a full description of the AVR Studio, please refer to the AVR Studio User Guide. Only high-
lights are presented in this document.
All necessary execution commands are available in AVR Studio, both on source level and on
disassembly level. The user can execute the program, single step through the code either by
tracing into or stepping over functions, step out of functions, place the cursor on a statement and
execute until the statement is reached, stop the execution, and reset the execution target. In
addition, the user can have an unlimited number of code Break Points (using the BREAK
instruction) and up to two data memory Break Points, alternatively combined as a mask (range)
Break Point.
A scan chain on the interface between the internal AVR CPU and the internal peripheral
units
Break Point unit
Communication interface between the CPU and JTAG system
4 single Program Memory Break Points
3 Single Program Memory Break Point + 1 single Data Memory Break Point
2 single Program Memory Break Points + 2 single Data Memory Break Points
2 single Program Memory Break Points + 1 Program Memory Break Point with mask (“range
Break Point”)
2 single Program Memory Break Points + 1 Data Memory Break Point with mask (“range
Break Point”)
Figure
83, the hardware support for On-chip Debugging consists mainly of
202.
®
®
, may however use one or more of these resources for its inter-
Windows
®
95/98/2000, Windows NT
“On-chip debug specific JTAG
ATmega162/V
®
, and Windows XP
®
.
201
Related parts for ATMEGA162V-8AJ
Image
Part Number
Description
Manufacturer
Datasheet
Request
R

Part Number:
Description:
Manufacturer:
Atmel Corporation
Datasheet:

Part Number:
Description:
IC AVR MCU 16K 16MHZ 5V 44TQFP
Manufacturer:
Atmel
Datasheet:

Part Number:
Description:
IC AVR MCU 16K 16MHZ 5V 40DIP
Manufacturer:
Atmel
Datasheet:

Part Number:
Description:
IC AVR MCU 16K 16MHZ 5V 44-QFN
Manufacturer:
Atmel
Datasheet:

Part Number:
Description:
IC MCU AVR 16K 5V 16MHZ 44-TQFP
Manufacturer:
Atmel
Datasheet:

Part Number:
Description:
IC MCU AVR 16K 5V 16MHZ 44-QFN
Manufacturer:
Atmel
Datasheet:

Part Number:
Description:
MCU AVR 16KB FLASH 16MHZ 44QFN
Manufacturer:
Atmel
Datasheet:

Part Number:
Description:
MCU AVR 16KB FLASH 16MHZ 44TQFP
Manufacturer:
Atmel
Datasheet:

Part Number:
Description:
IC MCU AVR 16K 5V 16MHZ 44-TQFP
Manufacturer:
Atmel
Datasheet:

Part Number:
Description:
IC MCU AVR 16K 5V 16MHZ 44-QFN
Manufacturer:
Atmel
Datasheet:

Part Number:
Description:
IC MCU AVR 16K 5V 16MHZ 40-DIP
Manufacturer:
Atmel
Datasheet:

Part Number:
Description:
IC MCU AVR 16K 5V 16MHZ 40-DIP
Manufacturer:
Atmel
Datasheet:

Part Number:
Description:
IC MCU AVR 16K 5V 16MHZ 44-TQFP
Manufacturer:
Atmel
Datasheet:


