MCP3909EV-MCU16 Microchip Technology, MCP3909EV-MCU16 Datasheet - Page 23
MCP3909EV-MCU16
Manufacturer Part Number
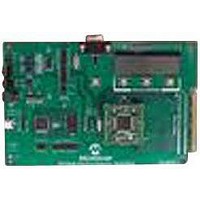
MCP3909EV-MCU16
Description
EVALUATION BOARD FOR MCP3909
Manufacturer
Microchip Technology
Datasheets
1.MCP3909T-ISS.pdf
(44 pages)
2.MCP3909T-ISS.pdf
(104 pages)
3.MCP3909EV-MCU16.pdf
(38 pages)
Specifications of MCP3909EV-MCU16
Number Of Adc's
2
Number Of Bits
16
Sampling Rate (per Second)
15k
Data Interface
Serial
Inputs Per Adc
1 Differential
Input Range
±1 V
Voltage Supply Source
Analog and Digital
Operating Temperature
-40°C ~ 85°C
Utilized Ic / Part
MCP3909
Silicon Manufacturer
Microchip
Application Sub Type
ADC
Kit Application Type
Data Converter
Silicon Core Number
MCP3909
Kit Contents
Board
Lead Free Status / RoHS Status
Lead free / RoHS Compliant


3.5
3.6
3.7
© 2008 Microchip Technology Inc.
HISTOGRAM WINDOW - NOISE ANALYSIS
FFT WINDOW - FREQUENCY DOMAIN ANALYSIS
AUXILIARY DATA WINDOW
For the evaluation of the Effective Number Of Bits (ENOB) the GUI will compute some
statistical parameters: “mean” value, “standard deviation” and “variance”, for each
channel. These parameters can be seen at the bottom of the GUI, right under the
Histogram Graph screens. The formula used for the ENOB is:
EQUATION 3-1:
The right value for the acquired ENOB is correct only when the DC signal is applied on
the inputs.
The distribution of noise from the acquired signal can be seen on the Histogram Graph
screens.These graphs are indicating how many transitions took place in between two
codes. In the case of a noiseless signal (a straight line), the histogram graphs will show
nothing. If the signal is a digital noise signal (transition between two values) the
histogram will indicate just one vertical bar.
The spectrum of the acquired signal is visible in the Signal Spectrum screen. Above
these graphics there is a button that can be used to set the Y scale to be linear or
logarithmic. A logarithmic scale on Y axis is useful to see the level of low harmonics, or
the noise floor.
The length of the FFT is given by the buffer length and the sampling speed. The X axis
is directly scaled in Hz units. Do remember when changing the sampling speed in the
GUI, to manually change the sampling speed on the MCP3909 ADC Evaluation Board
for 16-Bit MCUs.
Another feature of the software is the window selection for the FFT computation. This
is done from the “Window” fields, in the lower region of the GUI, right above the
Current FFT screens. The user can select from a large number of windows.
Since GUI is performing the spectral analysis of the acquired signal, it is possible to
compute AC performance parameters of the ADC: “THD” and “SINAD” are shown on
the indicators, right under the Histogram Graph screens.
At the bottom of the GUI there are two screens called Current FFT and Voltage FFT.
These graphics are used to compare the FFT computed on the MCU (the green FFT)
with the one computed on the PC (the red FFT). The Current channel is CH0, and the
Voltage channel is CH1.
In the beginning these graphs do not indicate anything. For a correct use it is necessary
to have the same window used on both MCU and PC. In addition, on the PC, the Linear
scale for the FFT must be used.
Because on the MCU the FFT has 128 points in length, the buffer length should be the
same.
The MCU is not sending the data to the PC simultaneously. To choose which view to
see (Current FFT or Voltage FFT), press SW3 placed on the board.
ENOB
=
16 log
–
2
( )
MCP3909 PC Software Tool
σ
DS51777A-page 19
Related parts for MCP3909EV-MCU16
Image
Part Number
Description
Manufacturer
Datasheet
Request
R

Part Number:
Description:
Manufacturer:
Microchip Technology Inc.
Datasheet:
Part Number:
Description:
Manufacturer:
Microchip Technology Inc.
Datasheet:
Part Number:
Description:
Manufacturer:
Microchip Technology Inc.
Datasheet:
Part Number:
Description:
Manufacturer:
Microchip Technology Inc.
Datasheet:
Part Number:
Description:
Manufacturer:
Microchip Technology Inc.
Datasheet:
Part Number:
Description:
Manufacturer:
Microchip Technology Inc.
Datasheet:
Part Number:
Description:
Manufacturer:
Microchip Technology Inc.
Datasheet:
Part Number:
Description:
Manufacturer:
Microchip Technology Inc.
Datasheet: