ULINKPRO Keil, ULINKPRO Datasheet - Page 95
ULINKPRO
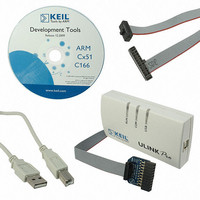
Manufacturer Part Number
ULINKPRO
Description
KIT DEBUG/TRACE UNIT HIGH SPEED
Manufacturer
Keil
Type
In-Circuit, Real-Time Debugger/Programmerr
Specifications of ULINKPRO
Contents
Module
For Use With/related Products
ARM7, ARM9, Cortex
Lead Free Status / RoHS Status
Lead free / RoHS Compliant


94
Chapter 7. Debugging
Using the Command Window
Generic compile and
debug information are
displayed here while
stepping through the code.
Additional notifications
are provided if, for
example, memory areas
cannot be accessed. Enter
debugger commands on
the Command Line of the
Command Window. Valid instructions will rise on its status bar with hints to
parameters and parameter options. Insert expressions to view or modify the
content of registers, variables, and memory areas. You can invoke debugger
script functions as well. We strongly advise you to make use of the detailed on-
line help information, by pressing
. Describing the many options available is
F1
beyond the scope of this book.
Using the Disassembly Window
Configure this window by
invoking its Context
Menu. You can use this
window to view the time
an instruction needs to
execute or to display the
number of calls. You can
also set or remove
breakpoints and
bookmarks.
View a trace history of previously executed instructions through the
View – Trace – View Trace Records Menu. To view a history trace, enable the
option View – Trace – Enable Trace Recording.
If the Disassembly Window is the active window, single-stepping works at the
assembler instruction level rather than at the program source level.
Related parts for ULINKPRO
Image
Part Number
Description
Manufacturer
Datasheet
Request
R

Part Number:
Description:
MCU, MPU & DSP Development Tools USB-JTAG Adapter
Manufacturer:
Keil Tools

Part Number:
Description:
KEIL C-COMPILER INTERNATIONAL
Manufacturer:
Silicon Laboratories Inc
Part Number:
Description:
KEIL C-COMPILER US VERSION
Manufacturer:
Silicon Laboratories Inc

Part Number:
Description:
DEV KIT FOR STM32
Manufacturer:
STMicroelectronics
Datasheet:

Part Number:
Description:
KIT STARTER FOR STM32
Manufacturer:
STMicroelectronics
Datasheet:

Part Number:
Description:
KIT STARTER FOR STM32F10XE MCU
Manufacturer:
STMicroelectronics
Datasheet:

Part Number:
Description:
KIT STARTER KEIL FOR STR910
Manufacturer:
STMicroelectronics
Datasheet:


Part Number:
Description:
Microcontroller Modules & Accessories KEIL ULINK PRO 5V ADAPTOR KIT
Manufacturer:
Keil Software
Part Number:
Description:
Development Boards & Kits - ARM KEIL NUVOTON EVAL BD CORTEX-M0 + ULINK-ME
Manufacturer:
Keil Tools
Datasheet:
Part Number:
Description:
Development Boards & Kits - ARM KEIL NUVOTON EVAL BD CORTEX-M0
Manufacturer:
Keil Tools
Datasheet:

Part Number:
Description:
BOARD EVAL FOR LPC213X ARM MCU
Manufacturer:
NXP Semiconductors
Datasheet:

Part Number:
Description:
K60N512 Keil Tower Kit
Manufacturer:
Freescale Semiconductor
Datasheet: