ULINKPRO Keil, ULINKPRO Datasheet - Page 94
ULINKPRO
Manufacturer Part Number
ULINKPRO
Description
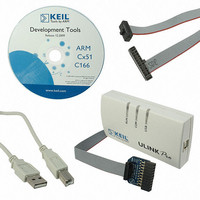
KIT DEBUG/TRACE UNIT HIGH SPEED
Manufacturer
Keil
Type
In-Circuit, Real-Time Debugger/Programmerr
Specifications of ULINKPRO
Contents
Module
For Use With/related Products
ARM7, ARM9, Cortex
Lead Free Status / RoHS Status
Lead free / RoHS Compliant


Getting Started: Creating Applications with µVision
Debug Mode
Most editor features are also available while debugging. The Find command can
be used to locate source text and source code can be modified. Much of the
Debugger interface is identical to the Text Editor interface.
However, in Debug Mode the following additional features, menus, and
windows are available:
Debug Menu and Debug Toolbar – for accessing debug commands
Besides the disabled build commands, you may not:
Peripherals Menu – is populated with peripheral dialogs used to monitor the
environment
Command Window – for executing debug commands and for showing
debugger messages
Disassembly Window – provides access to source code disassembly
Registers Window – to view and change values in registers directly
Call Stack Window – to examine the programs call tree
Memory, Serial, and Watch Windows – to monitor the application
Performance Analyzer Window – to fine tune the application for
performance
Code Coverage Window – to inspect the code for safety-critical systems
Logic Analyzer Window – to study signals and variables in a graphical form
Execution Profiler – to examine the execution time and number of calls
Instruction Trace Window – to follow execution of the program sequence
Symbol Window – to locate program objects comfortably
System Viewer – to supervise peripheral registers
Multiple Debug Restore Layouts – can be defined to switch between
preferred window arrangements
Modify the project structure
Change tool parameters
93
Related parts for ULINKPRO
Image
Part Number
Description
Manufacturer
Datasheet
Request
R

Part Number:
Description:
MCU, MPU & DSP Development Tools USB-JTAG Adapter
Manufacturer:
Keil Tools

Part Number:
Description:
KEIL C-COMPILER INTERNATIONAL
Manufacturer:
Silicon Laboratories Inc
Part Number:
Description:
KEIL C-COMPILER US VERSION
Manufacturer:
Silicon Laboratories Inc

Part Number:
Description:
DEV KIT FOR STM32
Manufacturer:
STMicroelectronics
Datasheet:

Part Number:
Description:
KIT STARTER FOR STM32
Manufacturer:
STMicroelectronics
Datasheet:

Part Number:
Description:
KIT STARTER FOR STM32F10XE MCU
Manufacturer:
STMicroelectronics
Datasheet:

Part Number:
Description:
KIT STARTER KEIL FOR STR910
Manufacturer:
STMicroelectronics
Datasheet:


Part Number:
Description:
Microcontroller Modules & Accessories KEIL ULINK PRO 5V ADAPTOR KIT
Manufacturer:
Keil Software
Part Number:
Description:
Development Boards & Kits - ARM KEIL NUVOTON EVAL BD CORTEX-M0 + ULINK-ME
Manufacturer:
Keil Tools
Datasheet:
Part Number:
Description:
Development Boards & Kits - ARM KEIL NUVOTON EVAL BD CORTEX-M0
Manufacturer:
Keil Tools
Datasheet:

Part Number:
Description:
BOARD EVAL FOR LPC213X ARM MCU
Manufacturer:
NXP Semiconductors
Datasheet:

Part Number:
Description:
K60N512 Keil Tower Kit
Manufacturer:
Freescale Semiconductor
Datasheet: