ULINKPRO Keil, ULINKPRO Datasheet - Page 136
ULINKPRO
Manufacturer Part Number
ULINKPRO
Description
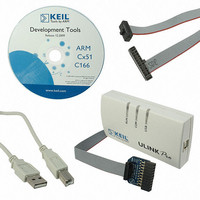
KIT DEBUG/TRACE UNIT HIGH SPEED
Manufacturer
Keil
Type
In-Circuit, Real-Time Debugger/Programmerr
Specifications of ULINKPRO
Contents
Module
For Use With/related Products
ARM7, ARM9, Cortex
Lead Free Status / RoHS Status
Lead free / RoHS Compliant


Getting Started: Creating Applications with µVision
Viewing and Changing On-Chip Peripherals
The “Measure” program accepts input from several I/O and A/D ports. Use the
µVision Debugger to view data and interact with peripherals. Changes made to
the inputs are reflected in the dialog window of each peripheral. Enter
Serial Window to monitor the output and the changes applied to input values.
The
“Measure” program to refresh the
time, I/O Ports, and the A/D Inputs
continuously. The input from the
I/O Port and the A/D converter
channels can be controlled from
peripheral dialogs, which are
available from the Peripherals Menu.
Using Peripheral Windows
The µVision Debugger provides windows for I/O and serial ports, A/D
converters, interrupts, timers, and for most other chip-specific peripherals.
Open the windows from the
Peripherals Menu.
The windows display the status of
the registers as well as the pins of
the simulated device.
Open the A/D Converter dialog to
view the status of the A/D controls
and A/D data. You can enter input
voltages for the Analog Input, which
are reflected in the Serial Window.
D
command causes the
Reset the simulated CPU
Start the program if it is not running already
Open the Serial Window if it is closed
D
in the
135
Related parts for ULINKPRO
Image
Part Number
Description
Manufacturer
Datasheet
Request
R

Part Number:
Description:
MCU, MPU & DSP Development Tools USB-JTAG Adapter
Manufacturer:
Keil Tools

Part Number:
Description:
KEIL C-COMPILER INTERNATIONAL
Manufacturer:
Silicon Laboratories Inc
Part Number:
Description:
KEIL C-COMPILER US VERSION
Manufacturer:
Silicon Laboratories Inc

Part Number:
Description:
DEV KIT FOR STM32
Manufacturer:
STMicroelectronics
Datasheet:

Part Number:
Description:
KIT STARTER FOR STM32
Manufacturer:
STMicroelectronics
Datasheet:

Part Number:
Description:
KIT STARTER FOR STM32F10XE MCU
Manufacturer:
STMicroelectronics
Datasheet:

Part Number:
Description:
KIT STARTER KEIL FOR STR910
Manufacturer:
STMicroelectronics
Datasheet:


Part Number:
Description:
Microcontroller Modules & Accessories KEIL ULINK PRO 5V ADAPTOR KIT
Manufacturer:
Keil Software
Part Number:
Description:
Development Boards & Kits - ARM KEIL NUVOTON EVAL BD CORTEX-M0 + ULINK-ME
Manufacturer:
Keil Tools
Datasheet:
Part Number:
Description:
Development Boards & Kits - ARM KEIL NUVOTON EVAL BD CORTEX-M0
Manufacturer:
Keil Tools
Datasheet:

Part Number:
Description:
BOARD EVAL FOR LPC213X ARM MCU
Manufacturer:
NXP Semiconductors
Datasheet:

Part Number:
Description:
K60N512 Keil Tower Kit
Manufacturer:
Freescale Semiconductor
Datasheet: