ULINKPRO Keil, ULINKPRO Datasheet - Page 133
ULINKPRO
Manufacturer Part Number
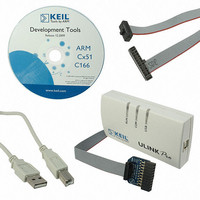
ULINKPRO
Description
KIT DEBUG/TRACE UNIT HIGH SPEED
Manufacturer
Keil
Type
In-Circuit, Real-Time Debugger/Programmerr
Specifications of ULINKPRO
Contents
Module
For Use With/related Products
ARM7, ARM9, Cortex
Lead Free Status / RoHS Status
Lead free / RoHS Compliant


132
Using the Trace Buffer
In any programming process, it is often required to investigate circumstances that
led to a certain state. You can guide the µVision Debugger to record instructions
into a trace memory buffer. In Debug Mode, you can review the trace buffer
using the View – Trace – Show Records in Disassembly command.
Whereas the trace information is always available in the Disassembly Window,
the Instruction Trace Window is enabled for ARM devices only.
In addition, inspect the Registers Windows showing register contents of the
selected instruction.
Invoke the Context Menu of the Disassembly Window to review the options
offered.
When you double-click in the Instruction Trace Window, the Disassembly
Window shows the corresponding instruction.
Use the Trace Windows command from the Debug Toolbar or from the
View – Trace – Instruction Trace Window Menu to view executed
instructions stored in the trace buffer
Chapter 9. Example Programs
Related parts for ULINKPRO
Image
Part Number
Description
Manufacturer
Datasheet
Request
R

Part Number:
Description:
MCU, MPU & DSP Development Tools USB-JTAG Adapter
Manufacturer:
Keil Tools

Part Number:
Description:
KEIL C-COMPILER INTERNATIONAL
Manufacturer:
Silicon Laboratories Inc
Part Number:
Description:
KEIL C-COMPILER US VERSION
Manufacturer:
Silicon Laboratories Inc

Part Number:
Description:
DEV KIT FOR STM32
Manufacturer:
STMicroelectronics
Datasheet:

Part Number:
Description:
KIT STARTER FOR STM32
Manufacturer:
STMicroelectronics
Datasheet:

Part Number:
Description:
KIT STARTER FOR STM32F10XE MCU
Manufacturer:
STMicroelectronics
Datasheet:

Part Number:
Description:
KIT STARTER KEIL FOR STR910
Manufacturer:
STMicroelectronics
Datasheet:


Part Number:
Description:
Microcontroller Modules & Accessories KEIL ULINK PRO 5V ADAPTOR KIT
Manufacturer:
Keil Software
Part Number:
Description:
Development Boards & Kits - ARM KEIL NUVOTON EVAL BD CORTEX-M0 + ULINK-ME
Manufacturer:
Keil Tools
Datasheet:
Part Number:
Description:
Development Boards & Kits - ARM KEIL NUVOTON EVAL BD CORTEX-M0
Manufacturer:
Keil Tools
Datasheet:

Part Number:
Description:
BOARD EVAL FOR LPC213X ARM MCU
Manufacturer:
NXP Semiconductors
Datasheet:

Part Number:
Description:
K60N512 Keil Tower Kit
Manufacturer:
Freescale Semiconductor
Datasheet: