MCB2470 Keil, MCB2470 Datasheet - Page 48
MCB2470
Manufacturer Part Number
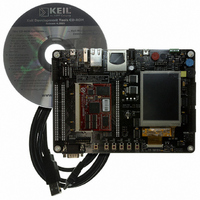
MCB2470
Description
BOARD EVAL NXP LPC247X SERIES
Manufacturer
Keil
Type
MCUr
Specifications of MCB2470
Contents
Board, Cable, CD
For Use With/related Products
LPC2478
Lead Free Status / RoHS Status
Lead free / RoHS Compliant


NXP Semiconductors
LPC2478_1
Preliminary data sheet
7.27.6 Memory mapping control
7.28.1 EmbeddedICE
7.28.2 Embedded trace
7.28 Emulation and debugging
The memory mapping control alters the mapping of the interrupt vectors that appear at the
beginning at address 0x0000 0000. Vectors may be mapped to the bottom of the Boot
ROM, the SRAM, or external memory. This allows code running in different memory
spaces to have control of the interrupts.
The LPC2478 support emulation and debugging via a JTAG serial port. A trace port allows
tracing program execution. Debugging and trace functions are multiplexed only with
GPIOs on P2[0] to P2[9]. This means that all communication, timer, and interface
peripherals residing on other pins are available during the development and debugging
phase as they are when the application is run in the embedded system itself.
The EmbeddedICE logic provides on-chip debug support. The debugging of the target
system requires a host computer running the debugger software and an EmbeddedICE
protocol convertor. The EmbeddedICE protocol convertor converts the Remote Debug
Protocol commands to the JTAG data needed to access the ARM7TDMI-S core present
on the target system.
The ARM core has a Debug Communication Channel (DCC) function built-in. The DCC
allows a program running on the target to communicate with the host debugger or another
separate host without stopping the program flow or even entering the debug state. The
DCC is accessed as a coprocessor 14 by the program running on the ARM7TDMI-S core.
The DCC allows the JTAG port to be used for sending and receiving data without affecting
the normal program flow. The DCC data and control registers are mapped in to addresses
in the EmbeddedICE logic.
Since the LPC2478 have significant amounts of on-chip memories, it is not possible to
determine how the processor core is operating simply by observing the external pins. The
ETM provides real-time trace capability for deeply embedded processor cores. It outputs
information about processor execution to a trace port. A software debugger allows
configuration of the ETM using a JTAG interface and displays the trace information that
has been captured.
The ETM is connected directly to the ARM core and not to the main AMBA system bus. It
compresses the trace information and exports it through a narrow trace port. An external
Trace Port Analyzer captures the trace information under software debugger control. The
trace port can broadcast the Instruction trace information. Instruction trace (or PC trace)
shows the flow of execution of the processor and provides a list of all the instructions that
were executed. Instruction trace is significantly compressed by only broadcasting branch
addresses as well as a set of status signals that indicate the pipeline status on a cycle by
cycle basis. Trace information generation can be controlled by selecting the trigger
resource. Trigger resources include address comparators, counters and sequencers.
Since trace information is compressed the software debugger requires a static image of
the code being executed. Self-modifying code can not be traced because of this
restriction.
Rev. 01 — 9 February 2007
Fast communication chip
LPC2478
© NXP B.V. 2007. All rights reserved.
48 of 76
Related parts for MCB2470
Image
Part Number
Description
Manufacturer
Datasheet
Request
R

Part Number:
Description:
KIT REF SYSTEM 78K0 UPD78F0712
Manufacturer:
Renesas Electronics America
Datasheet:
Part Number:
Description:
KIT DEMO EVAL 78K0R IE3
Manufacturer:
Renesas Electronics America
Datasheet:
Part Number:
Description:
KIT EVAL SYSTEM 78K0 UPD78F0714
Manufacturer:
Renesas Electronics America
Datasheet:

Part Number:
Description:
KEIL C-COMPILER INTERNATIONAL
Manufacturer:
Silicon Laboratories Inc
Part Number:
Description:
KEIL C-COMPILER US VERSION
Manufacturer:
Silicon Laboratories Inc

Part Number:
Description:
DEV KIT FOR STM32
Manufacturer:
STMicroelectronics
Datasheet:

Part Number:
Description:
KIT STARTER FOR STM32
Manufacturer:
STMicroelectronics
Datasheet:

Part Number:
Description:
KIT STARTER FOR STM32F10XE MCU
Manufacturer:
STMicroelectronics
Datasheet:

Part Number:
Description:
KIT STARTER KEIL FOR STR910
Manufacturer:
STMicroelectronics
Datasheet:


Part Number:
Description:
Microcontroller Modules & Accessories KEIL ULINK PRO 5V ADAPTOR KIT
Manufacturer:
Keil Software

Part Number:
Description:
BOARD EVAL FOR LPC213X ARM MCU
Manufacturer:
NXP Semiconductors
Datasheet:

Part Number:
Description:
K60N512 Keil Tower Kit
Manufacturer:
Freescale Semiconductor
Datasheet: