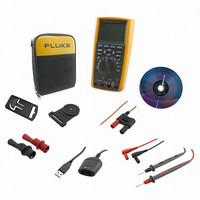
FLUKE-289/FVF Fluke Electronics, FLUKE-289/FVF Datasheet - Page 53

FLUKE-289/FVF
Manufacturer Part Number
FLUKE-289/FVF
Description
COMBO KIT DMM & ACCESSORY
Manufacturer
Fluke Electronics
Series
FlukeView® Forms, 28xr
Type
Digital (DMM)r
Datasheet
1.FLUKE-289.pdf
(88 pages)
Specifications of FLUKE-289/FVF
Includes
Battery, Case, Clips, Software, Temperature Probe, Test Leads
Style
Handheld
Display Digits
4.5
Display Type
LCD, Bar Graph
Display Count
50000
Function
Voltage, Current, Resistance, Capacitance, Temperature, Frequency
Functions, Extra
Continuity, dB
Features
Data Logging, Hold, Memory, Min/Max/Ave
Ranging
Auto/Manual
Response
True RMS
Lead Free Status / RoHS Status
Not applicable / RoHS non-compliant
Other names
289/FVF
614-1063
614-1063
selector to the menu item labeled Hz,%,ms. Next press the
softkey labeled Hz.
As shown in Figure 24, the frequency of the input signal is
displayed in the primary display. The volts or amps value of the
signal is shown in the secondary display. The bar graph does not
indicate frequency but indicates the volts or amps value of the
input signal.
0
Menu
8:10pm
60.050
Figure 24. Frequency Display
100
Save
200
123.45
300
400
VAC
06/13/07
Auto Range
Hz
Setup
500 VAC
est22.eps
Selection between a rising trigger c or falling trigger dedge is
performed by pressing the softkey labeled c d. This softkey
toggles the trigger setting between the two selections.
The following are tips for frequency measurements:
If a reading shows as 0 Hz or is unstable, the input signal may be
below or near the trigger level. You can usually correct these
problems by manually selecting a lower input range, which
increases the sensitivity of the meter.
If a reading seems to be a multiple of what you expect, the input
signal may be distorted. Distortion can cause multiple triggerings
of the frequency counter. Selecting a higher voltage range might
solve this problem by decreasing the sensitivity of the meter. In
general, the lowest frequency displayed is the correct one.
Measuring Duty cycle
Duty cycle (or duty factor) is the percentage of time a signal is
above or below a trigger level during one cycle, as shown in
Figure 25.
The duty-cycle mode is optimized for measuring the on or off
time of logic and switching signals. Systems such as electronic
fuel injection systems and switching power supplies are
controlled by pulses of varying width, which can be checked by
measuring duty cycle.
Making Measurements
43


