ATF-541M4-BLK Avago Technologies US Inc., ATF-541M4-BLK Datasheet - Page 10
ATF-541M4-BLK
Manufacturer Part Number
ATF-541M4-BLK
Description
IC ENHANCED MOD SUDIOMORPHIC HEM
Manufacturer
Avago Technologies US Inc.
Datasheet
1.ATF-541M4-BLK.pdf
(16 pages)
Specifications of ATF-541M4-BLK
Gain
17.5dB
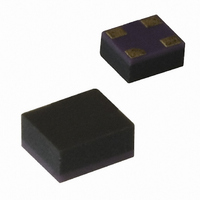
Package / Case
4-MiniPak (1412)
Current Rating
120mA
Power - Output
21.4dBm
Frequency
2GHz
Transistor Type
pHEMT FET
Noise Figure
0.5dB
Current - Test
60mA
Voltage - Test
3V
Drain Source Voltage Vds
3V
Continuous Drain Current Id
120mA
Power Dissipation Pd
360mW
Noise Figure Typ
0.5dB
Rf Transistor Case
MiniPak
No. Of Pins
4
Frequency Max
10GHz
Drain Current Idss Max
60mA
Rohs Compliant
Yes
Lead Free Status / RoHS Status
Lead free / RoHS Compliant
Other names
Q2380948


10
S and Noise Parameter Measurements
The position of the reference planes
used for the measurement of both S
and Noise Parameter measurements
is shown in Figure 20. The reference
plane can be described as being at
the center of both the gate and drain
pads.
S and noise parameters are measured
with a 50 ohm microstrip test fixture
made with a 0.010" thickness alu‑
minum substrate. Both source leads
are connected directly to ground via
a 0.010" thickness metal rib which
provides a very low inductance path
to ground for both source leads. The
inductance associated with the ad‑
dition of printed circuit board plated
through holes and source bypass
capacitors must be added to the
computer circuit simulation to prop‑
erly model the effect of grounding
the source leads in a typical amplifier
design.
Figure 20.
Noise Parameter Applications Information
The Fmin values are based on a set
of 16 noise figure measurements
made at 16 different impedances
using an ATN NP5 test system. From
these measurements, a true Fmin is
calculated. Fmin represents the true
minimum noise figure of the device
when the device is presented with an
impedance matching network that
transforms the source impedance,
typically 50Ω, to an impedance repre‑
sented by the reflection coefficient Γ
The designer must design a matching
network that will present Γ
device with minimal associated circuit
losses. The noise figure of the com‑
Source
Pin 3
Pin 2
Gate
Reference
Plane
Microstrip
Transmission Lines
Sx
o
Drain
Pin 4
Source
Pin 1
to the
o
.
pleted amplifier is equal to the noise
figure of the device plus the losses of
the matching network preceding the
device. The noise figure of the device
is equal to Fmin only when the device
is presented with Γ
coefficient of the matching network is
other than Γ
the device will be greater than Fmin
based on the following equation.
NF = F
Where Rn/Zo is the normalized noise
resistance, Γ
tion coefficient required to produce
Fmin and Γ
cient of the source impedance actu‑
ally presented to the device.
The losses of the matching networks
are non‑zero and they will also add to
the noise figure of the device creating
a higher amplifier noise figure. The
losses of the matching networks are
related to the Q of the components
and associated printed circuit board
loss. Γ
frequencies and increases as fre‑
quency is lowered. Larger gate width
devices will typically have a lower Γ
as compared to narrower gate width
devices. Typically for FETs , the higher
Γ
much higher than 50Ω is required for
the device to produce Fmin. At VHF
frequencies and even lower L Band
frequencies, the required imped‑
ance can be in the vicinity of several
thousand ohms. Matching to such a
high impedance requires very hi‑Q
components in order to minimize cir‑
cuit losses. As an example at 900 MHz,
when airwwound coils (Q>100)are
used for matching networks, the loss
can still be up to 0.25 dB which will
add directly to the noise figure of the
device. Using muiltilayer molded in‑
ductors with Qs in the 30 to 50 range
results in additional loss over the air‑
wound coil. Losses as high as 0.5 dB
or greater add to the typical 0.15 dB
Fmin of the device creating an ampli‑
fier noise figure of nearly 0.65 dB.
o
usually infers that an impedance
min
o
is typically fairly low at higher
+ 4 R
Zo (|1 + Γ
s
o
o
, then the noise figure of
is the reflection coeffi‑
n
is the optimum reflec‑
|Γ
o
. If the reflection
s
o
– Γ
|
2
)(1 ‑ |Γ
o
|
2
s
|
2
)
o
SMT Assembly
The package can be soldered us‑
ing either lead‑bearing or lead‑free
alloys (higher peak temperatures).
Reliable assembly of surface mount
components is a complex process that
involves many material, process, and
equipment factors, including: method
of heating (e.g. IR or vapor phase
reflow, wave soldering, etc) circuit
board material, conductor thickness
and pattern, type of solder alloy, and
the thermal conductivity and thermal
mass of components. Components
with a low mass, such as the Minipak
1412 package, will reach solder reflow
temperatures faster than those with a
greater mass.
The recommended leaded solder
time‑temperature profile is shown in
Figure 21. This profile is representative
of an IR reflow type of surface mount
assembly process. After ramping up
from room temperature, the circuit
board with components attached
to it (held in place with solder paste)
passes through one or more preheat
zones. The preheat zones increase the
temperature of the board and compo‑
nents to prevent thermal shock and
begin evaporating solvents from the
solder paste. The reflow zone briefly
elevates the temperature sufficiently
to produce a reflow of the solder.
The rates of change of temperature
for the ramp‑up and cool‑down zones
are chosen to be low enough to not
cause deformation of board or dam‑
age to components due to thermal
shock. The maximum temperature
in the reflow zone (Tmax) should not
exceed 235°C for leaded solder.
These parameters are typical for a
surface mount assembly process for
the ATF‑541M4. As a general guide‑
line, the circuit board and compo‑
nents should only be exposed to the
minimum temperatures and times
the necessary to achieve a uniform
reflow of solder.
The recommended lead‑free reflow
profile is shown in Figure 22.
Related parts for ATF-541M4-BLK
Image
Part Number
Description
Manufacturer
Datasheet
Request
R

Part Number:
Description:
IC TRANS E-PHEMT 2GHZ SOT-343
Manufacturer:
Avago Technologies US Inc.
Datasheet:

Part Number:
Description:
IC PHEMT 2GHZ 3V 30MA SOT-343
Manufacturer:
Avago Technologies US Inc.
Datasheet:

Part Number:
Description:
IC PHEMT 2GHZ 2.7V 10MA MINIPAK
Manufacturer:
Avago Technologies US Inc.
Datasheet:

Part Number:
Description:
IC PHEMT 2GHZ 2.7V 10MA SOT-343
Manufacturer:
Avago Technologies US Inc.
Datasheet:
Part Number:
Description:
IC PHEMT 2GHZ 3V 60MA SOT-343
Manufacturer:
Avago Technologies US Inc.
Datasheet:
Part Number:
Description:
IC PHEMT 1.9GHZ 80MA LN SOT-343
Manufacturer:
Avago Technologies US Inc.
Datasheet:
Part Number:
Description:
IC PHEMT 1.9GHZ 15MA LN SOT-343
Manufacturer:
Avago Technologies US Inc.
Part Number:
Description:
IC PHEMT 1.9GHZ 15MA LN SOT-343
Manufacturer:
Avago Technologies US Inc.
Datasheet:
Part Number:
Description:
IC PHEMT 1.9GHZ 60MA LN SOT-343
Manufacturer:
Avago Technologies US Inc.
Datasheet:
Part Number:
Description:
IC TRANS E-PHEMT 2GHZ SOT-343
Manufacturer:
Avago Technologies US Inc.
Datasheet:
Part Number:
Description:
IC TRANS E-PHEMT 2GHZ SOT-343
Manufacturer:
Avago Technologies US Inc.
Datasheet:
Part Number:
Description:
IC TRANS E-PHEMT 2GHZ SOT-343
Manufacturer:
Avago Technologies US Inc.
Datasheet:

Part Number:
Description:
TRANSISTOR,HEMT,N-CHAN,5.5V V(BR)DSS,175mA I(DSS),SOT-343R
Manufacturer:
Avago Technologies US Inc.
Part Number:
Description:
TRANSISTOR,HEMT,N-CHAN,3V V(BR)DSS,15mA I(DSS),SOT-363
Manufacturer:
Avago Technologies US Inc.
Datasheet:
Part Number:
Description:
TRANSISTOR,HEMT,N-CHAN,4.5V V(BR)DSS,90mA I(DSS),SOT-343R
Manufacturer:
Avago Technologies US Inc.
Datasheet: