ATAVRTS2080B Atmel, ATAVRTS2080B Datasheet - Page 71
ATAVRTS2080B
Manufacturer Part Number
ATAVRTS2080B
Description
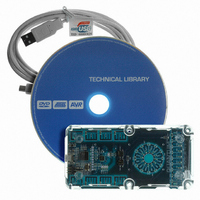
BOARD EVAL FOR ATTINY88 LIBRARY
Manufacturer
Atmel
Series
QTouch™r
Specifications of ATAVRTS2080B
Sensor Type
Touch, Capacitive
Sensing Range
1 Rotor, 1 Slider, and 2 Buttons/Keys
Interface
Application Programming Interface (API)
Voltage - Supply
1.8 V ~ 5.5 V
Embedded
Yes, MCU, 8-Bit
Utilized Ic / Part
ATtiny88
Tool Type
Development Kit
Cpu Core
AVR 8 / 32
Data Bus Width
8 bit
Core Architecture
AVR
Silicon Manufacturer
Atmel
Silicon Core Number
ATtiny88
Silicon Family Name
AVR
Kit Contents
Board CD Docs
Development Tool Type
Hardware / Software - Eval/Demo Board
Rohs Compliant
Yes
Lead Free Status / RoHS Status
Lead free / RoHS Compliant
Sensitivity
-
Lead Free Status / Rohs Status
Details
Other names
Q4359953


5.6.11.6 Debug Support in Example applications
The EVK2080 and QT600 applications provide output debug information on standard GPIO pins
through the USB Bridge IC to PC software for display by AVR QTouch Studio. Similarly for
ATMEL devices that are not supported through EVK or QT600 kits, the output measurement
values can be viewed through AVR QTouch Studio using the same QDebug protocol and QT600
USB bridge.
If a QT600 bridge is not available, please refer to section 5.6.11.6.3 for more information on
observing the output touch measurement data without the use of a USB bridge or AVR QTouch
Studio.
5.6.11.6.1 Debug Support in the sample applications for EVK2080 and QT600 boards
The sample applications provided for the EVK2080 boards, QT600 boards and the other example
projects output debug information which is captured by a USB bridge chip and then routed to the
QTouch Studio for display.
Note:
The port and pins assigned for the QDebug protocol with the example projects are arbitrary and
have to be changed based on the project configuration chosen and pin availability.
A separate App note is available on the Atmel website (in QTouch libraries webpage) explaining
the QT600 debug protocol.
5.6.11.6.2 How to turn on the debug option
In the project options, the symbol definition _DEBUG_INTERFACE_ is used to enable reporting
the debug data. Based on the IDE used, you can do the following to enable the debug feature
IAR-EWAVR:
In the project options -> C/C++ compiler -> Preprocessor Tab
Add the Directive _DEBUG_INTERFACE_
WINAVR- GCC:
Figure 5-23 : Enabling Debug Support for the library in IAR IDE
71
Related parts for ATAVRTS2080B
Image
Part Number
Description
Manufacturer
Datasheet
Request
R


Part Number:
Description:
DEV KIT FOR AVR/AVR32
Manufacturer:
Atmel
Datasheet:

Part Number:
Description:
INTERVAL AND WIPE/WASH WIPER CONTROL IC WITH DELAY
Manufacturer:
ATMEL Corporation
Datasheet:
Part Number:
Description:
Low-Voltage Voice-Switched IC for Hands-Free Operation
Manufacturer:
ATMEL Corporation
Datasheet:
Part Number:
Description:
MONOLITHIC INTEGRATED FEATUREPHONE CIRCUIT
Manufacturer:
ATMEL Corporation
Datasheet:
Part Number:
Description:
AM-FM Receiver IC U4255BM-M
Manufacturer:
ATMEL Corporation
Datasheet:
Part Number:
Description:
Monolithic Integrated Feature Phone Circuit
Manufacturer:
ATMEL Corporation
Datasheet:
Part Number:
Description:
Multistandard Video-IF and Quasi Parallel Sound Processing
Manufacturer:
ATMEL Corporation
Datasheet:
Part Number:
Description:
High-performance EE PLD
Manufacturer:
ATMEL Corporation
Datasheet:
Part Number:
Description:
8-bit Flash Microcontroller
Manufacturer:
ATMEL Corporation
Datasheet:
Part Number:
Description:
2-Wire Serial EEPROM
Manufacturer:
ATMEL Corporation
Datasheet: