TOOLSTICKLINDC Silicon Laboratories Inc, TOOLSTICKLINDC Datasheet - Page 6
TOOLSTICKLINDC
Manufacturer Part Number
TOOLSTICKLINDC
Description
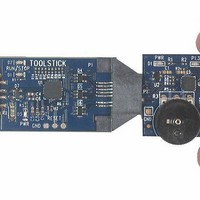
DAUGHTER CARD TOOLSTICK LIN
Manufacturer
Silicon Laboratories Inc
Series
ToolStickr
Specifications of TOOLSTICKLINDC
Module/board Type
Daughter Board
Interface Type
USB
Operating Supply Voltage
2.7 V to 3.6 V
Lead Free Status / RoHS Status
Contains lead / RoHS non-compliant
For Use With/related Products
USB Tool Stick
For Use With
336-1182 - ADAPTER USB DEBUG FOR C8051FXXX
Lead Free Status / Rohs Status
Lead free / RoHS Compliant
Other names
336-1383
Available stocks
Company
Part Number
Manufacturer
Quantity
Price
Company:

Part Number:
TOOLSTICKLINDC
Manufacturer:
Silicon Labs
Quantity:
135


ToolSt ick-LINDC
6.2. Connecting to the Device and Downloading Firmware
This section describes how to open the IDE, open and build a project, connect to a device and download the
firmware.
1. Open the Silicon Laboratories IDE from the Start → Programs → Silicon Laboratories menu.
2. In the IDE, go to Project → Open Project.
3. Browse to C:\SiLabs\MCU\ToolStick\LINDC\Firmware\.
4. Select F530DC_SoftwareTimer.wsp and click OK.
5. In the IDE, select Project → Rebuild Project.
6. Go to Options → Connection Options.
7. Select “USB Debug Adapter” for the Serial Adapter and “C2” for the Debug Interface, and then click “OK”.
8. Go to Debug → Connect.
9. Download the code using the download button on the menu bar or use alt-D.
Once these steps are completed, the firmware is built into an object file (step 5) and downloaded to the device
(step 9). The device is now ready to begin executing code. If all of these steps were followed successfully, the “Go”
option is enabled in the Debug menu. A green circle icon in the IDE toolbar also indicates that the device is ready
to run. If one of the steps leads to an error, make sure that the ToolStick is properly inserted in a USB port and start
again with step 6.
6.3. Running and Stopping Code Execution
Once the IDE is connected to the device and the firmware is loaded, the IDE can start and stop code execution.
The following steps can be performed using the buttons on the toolbar or using the options in the Debug menu.
1. To start code execution, click the green Go button on the toolbar or use the Debug → Go menu option. The
2. To stop code execution, click the red Stop button on the toolbar or use the Debug → Stop menu option. The
All debug windows and watch windows are refreshed when the device is stopped. If any of the values in these
windows have changed since the last time the device was halted, the new value is shown in red text instead of
black text.
6.4. Enabling and Using Watch Windows
To view and modify variables in code, the IDE provides Watch Windows. Watch windows are updated each time
the device is halted. This section of the User’s Guide explains how to add a variable to the watch window and
modify the variable. In the example code, the global variable Seconds is one variable of three variables that stores
the time since the firmware has begun executing.
1. If the device is running, stop execution using the Stop button or use the Debug → Stop menu option.
2. Scroll to the Global Variables section of the firmware and right-click on the variable Seconds. In the context
3. Start and Stop the device a few times. See that the value of the Seconds is incremented each second that the
4. When the device is halted, click on the value field in the watch window and change the value to 0. Then click the
5. Start and Stop the device a few times to watch the variable increment starting at 0.
6
output of the firmware is sent to the UART and is captured by ToolStick Terminal. Since ToolStick Terminal is not
connected at the moment, the output must be viewed using the IDE. Viewing the data in the IDE is discussed in
Section 6.4. The debug commands in the IDE (single-step, multiple-step, set breakpoint, and others) are
disabled when the device is running.
device will halt code execution and all of the registers and pins on the device will hold their state.
menu that appears, select Add Seconds and then choose Default. On the right-hand portion of the IDE, the
watch window appears and the variable is added. The current value of the variable is shown to the right of the
name.
firmware is running.
Refresh button or select Debug → Refresh to write the new value to the device.
Rev. 0.2
Related parts for TOOLSTICKLINDC
Image
Part Number
Description
Manufacturer
Datasheet
Request
R

Part Number:
Description:
KIT TOOL EVAL SYS IN A USB STICK
Manufacturer:
Silicon Laboratories Inc
Datasheet:

Part Number:
Description:
TOOLSTICK DEBUG ADAPTER
Manufacturer:
Silicon Laboratories Inc
Datasheet:

Part Number:
Description:
TOOLSTICK BASE ADAPTER
Manufacturer:
Silicon Laboratories Inc
Datasheet:

Part Number:
Description:
TOOLSTICK DAUGHTER CARD
Manufacturer:
Silicon Laboratories Inc
Datasheet:

Part Number:
Description:
TOOLSTICK DAUGHTER CARD
Manufacturer:
Silicon Laboratories Inc
Datasheet:

Part Number:
Description:
TOOLSTICK DAUGHTER CARD
Manufacturer:
Silicon Laboratories Inc
Datasheet:

Part Number:
Description:
TOOLSTICK DAUGHTER CARD
Manufacturer:
Silicon Laboratories Inc
Datasheet:

Part Number:
Description:
KIT STARTER TOOLSTICK
Manufacturer:
Silicon Laboratories Inc
Datasheet:

Part Number:
Description:
KIT UNIVERSITY TOOLSTICK STARTER
Manufacturer:
Silicon Laboratories Inc
Datasheet:

Part Number:
Description:
DAUGHTER CARD TOOLSTICK F330
Manufacturer:
Silicon Laboratories Inc
Datasheet:

Part Number:
Description:
CARD DAUGHTER UNIVRSTY TOOLSTICK
Manufacturer:
Silicon Laboratories Inc
Datasheet:

Part Number:
Description:
DAUGHTER CARD TOOLSTICK F582
Manufacturer:
Silicon Laboratories Inc
Datasheet:

Part Number:
Description:
DAUGHTER CARD TOOLSTICK F500
Manufacturer:
Silicon Laboratories Inc
Datasheet:

Part Number:
Description:
DAUGHTER CARD TOOLSTICK F540
Manufacturer:
Silicon Laboratories Inc
Datasheet:

Part Number:
Description:
DAUGHTER CARD TOOLSTICK F560
Manufacturer:
Silicon Laboratories Inc
Datasheet: