HS0005KCU11H Renesas Electronics America, HS0005KCU11H Datasheet
HS0005KCU11H
Specifications of HS0005KCU11H


Related parts for HS0005KCU11H


HS0005KCU11H Summary of contents
Page 1
To our customers, Old Company Name in Catalogs and Other Documents st On April 1 , 2010, NEC Electronics Corporation merged with Renesas Technology Corporation, and Renesas Electronics Corporation took over all the business of both companies. Therefore, although the ...
Page 2
All information included in this document is current as of the date this document is issued. Such information, however, is subject to change without any prior notice. Before purchasing or using any Renesas Electronics products listed herein, please confirm ...
Page 3
H8S, H8SX Family E10A-USB Emulator User’s Manual (HS0005 KCU01H, HS0005 KCU02H) Renesas Microcomputer Development Environment System H8S, H8SX Family E10A-USB HS0005KCU01HE-H8S Rev.12.00 2009.08 ...
Page 4
Rev. 12.00 Aug. 28, 2009 Page ii of xviii REJ10J1140-1200 ...
Page 5
Notes regarding these materials 1. This document is provided for reference purposes only so that Renesas customers may select the appropriate Renesas products for their use. Renesas neither makes warranties or representations with respect to the accuracy or completeness of ...
Page 6
Rev. 12.00 Aug. 28, 2009 Page iv of xviii REJ10J1140-1200 ...
Page 7
IMPORTANT INFORMATION • READ this user's manual before using this emulator product. • KEEP the user's manual handy for future reference. Do not attempt to use the emulator product until you fully understand its mechanism. Emulator Product: Throughout this document, ...
Page 8
LIMITED WARRANTY Renesas warrants its emulator products to be manufactured in accordance with published specifications and free from defects in material and/or workmanship. Renesas, at its option, will replace any emulator products returned intact to the factory, transportation charges prepaid, ...
Page 9
State Law: Some states do not allow the exclusion or limitation of implied warranties or liability for incidental or consequential damages, so the above limitation or exclusion may not apply to you. This warranty gives you specific legal rights, and ...
Page 10
READ this user's manual before using this emulator product. • KEEP the user's manual handy for future reference. Do not attempt to use the emulator product until you fully understand its mechanism. DEFINITION OF SIGNAL WORDS This is the ...
Page 11
Observe the precautions listed below. Failure will result in a FIRE HAZARD and will damage the user system and the emulator product or will result in PERSONAL INJURY. The USER PROGRAM will be LOST not ...
Page 12
Warnings on Emulator Usage Be sure to read and understand the warnings below before using this emulator. Note that these are the main warnings, not the complete list. Always switch OFF the host computer and user system before connecting or ...
Page 13
The High-performance Embedded Workshop is a powerful development environment for embedded applications targeted at Renesas microcontrollers. The main features are: • A configurable build engine that allows you to set-up compiler, assembler and linker options via an easy to use ...
Page 14
This manual describes preparation before using the emulator, emulator functions, debugging functions specific to the emulator, tutorial, and emulator's hardware and software specifications. Refer to the High-performance Embedded Workshop User's Manual for details on the information on the basic usage ...
Page 15
Document Conventions This manual uses the following typographic conventions: Table 2 Typographic Conventions Convention [Menu->Menu Option] FILENAME.C “enter this string” Key + Key (The “how to” symbol) Meaning Bold text with ‘->’ is used to indicate menu options (for example, ...
Page 16
When you have purchased the emulator represented in this user's manual, be sure to register it. As the H/W Tool Customer Registration Sheet is included with this product, fill it in and send the same contents to the following address ...
Page 17
Section 1 Overview..............................................................................................1 1.1 Warnings........................................................................................................................... 3 1.2 Environmental Conditions ................................................................................................ 4 1.3 Components ...................................................................................................................... 5 Section 2 Emulator Functions..............................................................................7 2.1 Overview........................................................................................................................... 7 2.2 Trace Functions................................................................................................................. 9 2.2.1 Branch Trace Function......................................................................................... 9 2.3 Break Function.................................................................................................................. 10 2.4 Memory Access Functions................................................................................................ 11 ...
Page 18
Downloading a Program ...................................................................................... 68 4.2.3 Setting the Program Flash Mode.......................................................................... 69 4.3 Debug Sessions ................................................................................................................. 76 4.3.1 Selecting a Session .............................................................................................. 76 4.3.2 Adding and Removing Sessions .......................................................................... 78 4.3.3 Saving Session Information ................................................................................. 81 4.4 Connecting the ...
Page 19
Go to Source ........................................................................................................ 104 5.3.20 Sequential Conditions .......................................................................................... 104 5.3.21 Editing Break Conditions..................................................................................... 104 5.3.22 Modifying Break Conditions ............................................................................... 104 5.3.23 Enabling Break Conditions .................................................................................. 104 5.3.24 Disabling Break Conditions................................................................................. 104 5.3.25 Deleting Break Conditions................................................................................... 105 5.3.26 Deleting ...
Page 20
Reviewing Breakpoints..................................................................................................... 136 6.11 Viewing Memory.............................................................................................................. 137 6.12 Watching Variables........................................................................................................... 139 6.13 Stepping Through a Program ............................................................................................ 143 6.13.1 Executing [Step In] Command............................................................................. 143 6.13.2 Executing [Step Out] Command.......................................................................... 145 6.13.3 Executing [Step Over] Command........................................................................ 146 6.14 Forced Breaking ...
Page 21
The High-performance Embedded Workshop provides a graphical user interface that eases the development and debugging of applications written in the C/C++ programming languages or assembly language for Renesas microcomputers. Its aim is to provide a powerful yet intuitive way of ...
Page 22
Section 1 Overview The emulator provides the following features: • Excellent cost-performance emulator Compactness and connection to the USB are obtained. • Realtime emulation Realtime emulation of the user system is enabled at the maximum operating frequency of the CPU. ...
Page 23
Warnings READ the following warnings before using the emulator product. Incorrect operation will damage the user system and the emulator product. The USER PROGRAM will be LOST. 1. Check all components against the component list after unpacking the emulator. ...
Page 24
Section 1 Overview 1.2 Environmental Conditions Observe the conditions listed in tables 1.1 and 1.2 when using the emulator. Failure will cause illegal operation in the user system, the emulator product, and the user program. Table 1.1 ...
Page 25
Table 1.2 lists the acceptable operating environments. Table 1.2 Operating Environments Item Description Operating system Windows Host computer Built-in Pentium recommended); IBM PC or compatible machine with USB 1.1/2.0 (Full- Speed). CPU Pentium recommended Minimum memory 1 Gbyte or more ...
Page 26
Section 1 Overview Rev. 12.00 Aug. 28, 2009 Page 6 of 188 REJ10J1140-1200 ...
Page 27
Section 2 Emulator Functions This section describes the emulator functions. They differ according to the device supported by the emulator. For the usage of each function, refer to section 6, Tutorial. 2.1 Overview Table 2.1 gives a functional overview of ...
Page 28
Section 2 Emulator Functions Table 2.1 Emulator Functions (cont) No. Item 5 Memory access functions 6 General/control register access function 7 Internal I/O register access function 8 Source-level debugging function 9 Command line function 10 Help function The specific functions ...
Page 29
Trace Functions The emulator has a trace function. Note: The number of branch instructions that can be acquired by a trace differs according to the product. For the number that can be specified for each product, refer to the ...
Page 30
Section 2 Emulator Functions 2.3 Break Function The emulator has the following three break functions. (1) Hardware break function (Break condition) Uses a break controller incorporated in the device. The access address, instruction fetch address, data, or bus cycle condition ...
Page 31
Memory Access Functions The emulator has the following memory access functions. (1) Memory read/write function [Memory] window: The memory contents are displayed in the window. Only the amount specified when the [Memory] window is opened can be read. Since ...
Page 32
Section 2 Emulator Functions (6) Other memory operation functions Other functions are as follows: • Memory fill • Memory copy • Memory save • Memory verify • Memory search • Internal I/O display • Displaying label and variable names and ...
Page 33
Section 3 Preparation before Use 3.1 Emulator Preparation Unpack the emulator and prepare it for use as follows: READ the reference sections shaded in figure 3.1 before using the emulator product. Incorrect operation will damage the user system and the ...
Page 34
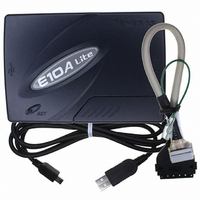
Section 3 Preparation before Use 3.2 Emulator Hardware Configuration As shown in figure 3.2, the emulator consists of an emulator, a USB cable, and a user system interface cable. The emulator is connected to the host computer via USB 1.1, ...
Page 35
The names of each section of the emulator are explained next. Emulator Top View: (a) E10A-USB logo plate: A yellow plate (for HS0005KCU01H red plate (for (b) Sliding switch cover: (c) ACTION LED: (d) Host connector: (e) User ...
Page 36
Section 3 Preparation before Use Emulator Host-side View: (a) Host-side connector: A USB connector for the host computer. Be sure to connect the provided USB cable. Rev. 12.00 Aug. 28, 2009 Page 16 of 188 REJ10J1140-1200 Figure 3.4 Emulator Host-side ...
Page 37
Emulator User-side View: (a) User-side connector: A user system interface cable is connected. Figure 3.5 Emulator User-side View Section 3 Preparation before Use Rev. 12.00 Aug. 28, 2009 Page 17 of 188 REJ10J1140-1200 ...
Page 38
Section 3 Preparation before Use Emulator Bottom View: This device complies with Part 15 of the FCC Rules. Operation is subject to the follow ing two conditions: (1) This device may not cause harmful interference, and (2) This device must ...
Page 39
CD-R The root directory of the CD-R contains a setup program for installing the emulator’s software. The folders contain the files and programs listed below. Table 3.1 Contents of the CD-R Directories Directory Name Contents Dlls Microsoft Drivers E10A-USB ...
Page 40
Section 3 Preparation before Use 3.5 Connecting the Emulator to the Host Computer This section describes how to connect the emulator to the host computer. For the position of each connector of the emulator, refer to section 3.2, Emulator Hardware ...
Page 41
The emulator is connected to the host computer via the USB 1.1, and also to the USB port conforming to USB 2.0. Figure 3.7 shows the system configuration. Figure 3.7 System Configuration when Connecting the Emulator to the Host Computer ...
Page 42
Section 3 Preparation before Use 3.6 Connecting the Emulator to the User System Use the procedure below to connect the emulator to the user system with the user system interface cable disconnect them when moving the emulator or ...
Page 43
The user system connector must be installed to the user system. Table 3.2 shows the recommended user system connector for the emulator. Table 3.2 Recommended User System Connector Connector Type Number 14-pin connector 2514-6002 Note: When designing the 14-pin ...
Page 44
Section 3 Preparation before Use Note that the pin number assignments of the user system connector differ from those of the connector manufacturer. Notes: 1. Connection of the signals differs depending on the package. For details, refer to the MCU ...
Page 45
Connecting System Ground Separate the frame ground from the signal ground at the user system. Failure will result in a FIRE HAZARD and will damage the user system and the emulator product or will result in ...
Page 46
Section 3 Preparation before Use 3.8 Setting the DIP Switches Do not change switches (SW2 and SW3) while the emulator and the user sytem are turned on. The changing of switches (SW2 and SW3) will result in a FIRE HAZARD ...
Page 47
Table 3.3 shows the relationships between settings and functions of DIP switches Use the settings depending on the usage of the user system. Use only the settings shown in table 3.3. Use of other settings will not ...
Page 48
Section 3 Preparation before Use 3.9 Interface Circuits in the Emulator Figure 3.12 shows interface circuits in the emulator. Use them as a reference to determine the value of the pull-up resistance. Note: The 74LVC2G125 operates at VCC (1.8 to ...
Page 49
Setting up the Emulator Set up the emulator’s firmware using the following procedures. Here describes how to set up the H8S device group. Note: Only one device group can be set up using the setup tool when the emulator ...
Page 50
Section 3 Preparation before Use 3.10.1 Setting up at Purchasing the Emulator or Updating the Version of Software Note: If you are using the HS0005KCU01H (serial No.: 03311C or later) or HS0005KCU02H (serial No.: 04146E or later) emulator hardware, the ...
Page 51
Device group of the emulator firmware: (b) Version number of the emulator firmware: (c) Version number of the setup program: Figure 3.15 [Start] Menu Figure 3.16 Setup Tool for Emulator Name of the device group currently set. The version ...
Page 52
Section 3 Preparation before Use Notes the version numbers shown in (b) and (c) are the same, setup of the emulator is not required. Setup the emulator only when “-.-.--.---“ is shown in (b) or the version number ...
Page 53
Turn the setup switch (SW1) to ‘0’, connect the USB cable again, and click the [OK] button. Setting up the emulator’s firmware is started. Notes the following dialog message is displayed, insert the USB cable again. Figure ...
Page 54
Section 3 Preparation before Use (5) When the following dialog box is displayed, setting up the emulator is completed. Figure 3.22 Message for Completion of Setting up the Emulator (6) When setting up the emulator has been completed, the following ...
Page 55
Setting up the Emulator by Using the License Tool to Add a Device Group In the license tool, the emulator for the current product group can be used for debugging another product group (device group such as SHxxxx Device ...
Page 56
Section 3 Preparation before Use (2) Setting up the emulator 1. Open the sliding switch cover and check that the switch (SW1) for setting the emulator is turned to ‘1’. 2. Select [Renesas] -> [License tool for E10A-USB] -> [H8S ...
Page 57
Notes the version numbers shown in (b) and (c) are the same, setup of the emulator is not required. Set up the emulator only when “-.-.--.---“ is shown in (b) or the version number of (b) is older ...
Page 58
Section 3 Preparation before Use Notes the following dialog message is displayed, insert the USB cable again. Figure 3.28 [License tool for H8S E10A-USB Emulator] Dialog Box 2. When [Add New Hardware Wizard] is displayed, select the [Search ...
Page 59
When the following dialog box is displayed, setting up the emulator is completed. Figure 3.30 Message for Completion of Setting up the Emulator (6) When setting up the emulator has been completed, the following message will be displayed. Turn ...
Page 60
Section 3 Preparation before Use 3.11 System Check When the software is executed, use the procedure below to check that the emulator is connected correctly. Here, use the workspace for a tutorial provided on the product. Refer to section 4, ...
Page 61
The [Welcome!] dialog box is displayed. [Create a new project workspace] radio button: [Open a recent project workspace] radio button: [Browse to another project workspace] radio button: Uses an existing workspace; this radio To use a workspace for the ...
Page 62
Section 3 Preparation before Use After the directory has been specified, select the following file and click the [Open] button. Figure 3.34 [Open Workspace] Dialog Box Rev. 12.00 Aug. 28, 2009 Page 42 of 188 REJ10J1140-1200 ...
Page 63
The [Select Emulator mode] dialog box is displayed. Figure 3.35 [Select Emulator mode] Dialog Box Select the MCU name in use from the [Device] drop-down list box. The following items are selected in the [Mode] group box. ⎯ E10A-USB ...
Page 64
Section 3 Preparation before Use 7. The [Connecting] dialog box is displayed and the emulator connection is started. 8. The dialog box shown in figure 3.37 is displayed if no product groups have been installed in the emulator at the ...
Page 65
Figure 3.38 Dialog Box to Confirm Updating of the H8S Emulator Firmware The USB cable must not be disconnected until writing is complete. Early disconnection may damage the emulator. Note: The above dialog boxes are only displayed if you are ...
Page 66
Section 3 Preparation before Use Figure 3.40 Dialog Box of the Power-on Request Message 10. Turn on the user system. 11. When using the H8S family microcomputer, the dialog box shown in figure 3.41 is displayed. Input the system clock ...
Page 67
Figure 3.42 [ID Code] Dialog Box Section 3 Preparation before Use Rev. 12.00 Aug. 28, 2009 Page 47 of 188 REJ10J1140-1200 ...
Page 68
Section 3 Preparation before Use 13. When "Connected" is displayed in the [Output] window of the High-performance Embedded Workshop, the emulator initiation is completed. Figure 3.43 High-performance Embedded Workshop Window Note: When the user program has already been downloaded to ...
Page 69
Notes the user system interface cable is disconnected from the connector on the user system, the following dialog box will appear. Figure 3.44 [Cable disconnected from connector] Dialog Box 2. If the emulator is not properly initialized, one ...
Page 70
Section 3 Preparation before Use (b) The following dialog box is displayed when an incorrect ID code has been input. For security, the flash memory is completely erased. Figure 3.46 [ID code error!] Dialog Box (c) The following dialog box ...
Page 71
If the following dialog box is displayed, the version of the firmware in the emulator may be old. Set up the firmware by using the setup tool. For the usage of the setup tool, refer to section 3.10, Setting ...
Page 72
Section 3 Preparation before Use (g) If the following dialog box is displayed, the MCU selected on activating the emulator does not match the actual MCU. Select the correct MCU. Figure 3.51 [MCU identification error] Dialog Box ...
Page 73
Section 4 Preparations for Debugging 4.1 Method for Activating High-performance Embedded Workshop This section describes the ways to create and modify workspaces using H8S family (H8S/xxxx E10A-USB SYSTEM). Replace ‘H8S/xxxx E10A-USB SYSTEM’ in the description (including figures) as ‘H8SX/xxxx E10A-USB ...
Page 74
Section 4 Preparations for Debugging In this section, we describe the following three ways to start up the High-performance Embedded Workshop: • [Create a new project workspace toolchain is not in use • [Create a new project workspace] ...
Page 75
The Project Generator is started. In this section, we omit description of the settings for the toolchain. If you have not purchased the toolchain, the following dialog box is displayed. Figure 4.3 [New Project Workspace] Dialog Box [Workspace Name] ...
Page 76
Section 4 Preparations for Debugging 3. The following dialog box is displayed. Figure 4.4 [Debugger Target] Dialog Box Check [H8S/xxxx E10A-USB SYSTEM] and click the [Next] button. Rev. 12.00 Aug. 28, 2009 Page 56 of 188 REJ10J1140-1200 ...
Page 77
Set the configuration file name. The configuration file saves the state of High-performance Embedded Workshop except for the emulator. Figure 4.5 [Debugger Options] Dialog Box This is the end of the emulator setting. Click the [Finish] button to exit ...
Page 78
Section 4 Preparations for Debugging 4.1.2 Creating the New Workspace (Toolchain Used the [Welcome!] dialog box that is displayed when the High-performance Embedded Workshop is activated, select [Create a new project workspace] radio button and click the [OK] ...
Page 79
The Project Generator is started. If you have purchased the toolchain, the following dialog box is displayed. Figure 4.7 [New Project Workspace] Dialog Box [Workspace Name] edit box: [Project Name] edit box: [CPU family] drop-down list box: Select the ...
Page 80
Section 4 Preparations for Debugging 3. Make the required setting for the toolchain. When the setting has been completed, the following dialog box is displayed. Figure 4.8 [New Project -7/9- Setting the Target System for Debugging] Dialog Box Check [H8S/xxxx ...
Page 81
Set the configuration file name. The configuration file saves the state of High-performance Embedded Workshop except for the emulator. Figure 4.9 [New Project -8/9- Setting the Debugger Options] Dialog Box This is the end of the emulator setting. Exit ...
Page 82
Section 4 Preparations for Debugging 5. After the High-performance Embedded Workshop has been activated, connect the emulator. However not needed to connect the emulator immediately after the High-performance Embedded Workshop has been activated. To connect the emulator, use ...
Page 83
In the list box that is circled in figure 4.10, select the session file name including the character string that has been set in the [Target name] text box in figure 4.9, [New Project -8/9- Setting the Debugger Options] dialog ...
Page 84
Section 4 Preparations for Debugging 4.1.3 Selecting an Existing Workspace 1. In the [Welcome!] dialog box that is displayed when the High-performance Embedded Workshop is activated, select [Browse to another project workspace] radio button and click the [OK] button. Rev. ...
Page 85
The [Open Workspace] dialog box is displayed. Select a directory in which you have created a workspace. After that, select the workspace file (.hws) and press the [Open] button. Figure 4.12 [Open Workspace] Dialog Box Note: In figure 4.12, ...
Page 86
Section 4 Preparations for Debugging 4.2 Setting at Emulator Activation 4.2.1 Setting at Emulator Activation A batch file of commands can be specified for automatic execution when the emulator is activated also possible to register multiple load modules ...
Page 87
Figure 4.14 [Debug Settings] Dialog Box ([Options] Page) The command batch file that is automatically executed at the specified timing is registered. The following four timings can be specified: • At connecting the emulator (At target connection) • Immediately before ...
Page 88
Section 4 Preparations for Debugging 4.2.2 Downloading a Program A download module is added under [Download modules] in the [Workspace] window. Open the load module of [Download modules] in the [Workspace] window by clicking the right- hand mouse button and ...
Page 89
Setting the Program Flash Mode The following describes the procedures when the emulator is used as the programming tool. The load module to be downloaded to the new workspace is registered and programmed. (a) Select the new project workspace. ...
Page 90
Section 4 Preparations for Debugging (b) Select the target MCU and click the [Finish] button. Figure 4.17 [Setting the Target System for Debugging] Dialog Box (c) The [Select Emulator mode] dialog box is displayed. Figure 4.18 [Select Emulator mode] Dialog ...
Page 91
Select the [Program Flash] mode. The contents to be displayed differ from each device. This is dedicated mode for each Note: device, and is incorporated in the internal ROM. This is not available for ROM-less products. Normal debugging is not ...
Page 92
Section 4 Preparations for Debugging (f) Select [Debug Setting] from the [Debug] menu. Figure 4.22 High-performance Embedded Workshop Window Rev. 12.00 Aug. 28, 2009 Page 72 of 188 REJ10J1140-1200 ...
Page 93
Select the download module with the [Add…] button. Figure 4.23 [Debug Settings] Dialog Box ([Target] Page) Section 4 Preparations for Debugging Rev. 12.00 Aug. 28, 2009 Page 73 of 188 REJ10J1140-1200 ...
Page 94
Section 4 Preparations for Debugging (h) The download file is displayed on [Projects]. Figure 4.24 [Workspace] Window ([Projects]) (i) Select and download the file with the right-hand mouse button. Figure 4.25 Download Menu of the [Workspace] Window ([Projects]) Rev. 12.00 ...
Page 95
The dialog box for sum checking is displayed and programming is completed. Checksum is a value that data in the internal ROM area has been added by byte user program exists, the value is calculated by H’FF. ...
Page 96
Section 4 Preparations for Debugging 4.3 Debug Sessions The High-performance Embedded Workshop stores all of your builder options into a configuration similar way, the High-performance Embedded Workshop stores your debugger options in a session. The debugging platforms, the ...
Page 97
From the dialog box 1. Select [Debug -> Debug Sessions…]. This will open the [Debug Sessions] dialog box (figure 4.29). Figure 4.29 [Debug Sessions] Dialog Box 2. Select the session you want to use from the [Current session] drop-down ...
Page 98
Section 4 Preparations for Debugging 4.3.2 Adding and Removing Sessions A new session can be added by copying settings from another session or removing a session. • To add a new empty session 1. Select [Debug -> Debug Sessions…] to ...
Page 99
To import an existing session into a new session file 1. Select [Debug -> Debug Sessions…] to display the [Debug Sessions] dialog box (figure 4.29). 2. Click the [Add…] button to display the [Add new session] dialog box (figure ...
Page 100
Section 4 Preparations for Debugging Figure 4.31 [Session Properties] Dialog Box • To make a session read-only 1. Select [Debug -> Debug Sessions…] to display the [Debug Sessions] dialog box (figure 4.29). 2. Select the session you would like to ...
Page 101
Saving Session Information To save a session Select [File -> Save Session]. Figure 4.32 [Save Session] Dialog Box Section 4 Preparations for Debugging Rev. 12.00 Aug. 28, 2009 Page 81 of 188 REJ10J1140-1200 ...
Page 102
Section 4 Preparations for Debugging 4.4 Connecting the Emulator Select either of the following two ways to connect the emulator: (1) Connecting the emulator after the setting at emulator activation Select [Debug settings] from the [Debug] menu to open the ...
Page 103
In the list box that is circled in figure 4.33, select the session file name including the character string that has been set in the [Target name] text box in figure 4.9, [New Project -8/9- Setting the Debugger Options] dialog ...
Page 104
Section 4 Preparations for Debugging 4.6 Ending the Emulator When using the toolchain, the emulator can be exited by using the following two methods: • Canceling the connection of the emulator being activated • Exiting the High-performance Embedded Workshop (1) ...
Page 105
This section describes the debugging operations and their related windows and dialog boxes. 5.1 Setting the Environment for Emulation 5.1.1 Opening the [Configuration] Dialog Box Selecting [Options -> Emulator -> System…] or clicking the [Emulator System] toolbar button ) opens ...
Page 106
Section 5 Debugging Note: The contents to be displayed differ depending on the MCU. Items that can be displayed in the sheet are listed below. Note: The items to be set differ between H8S, H8SX family and MCUs. For functions ...
Page 107
Sets the frequency of the JTAG clock. Selects whether or not the contents of the flash memory are acquired by the emulator when the user program is stopped or the ...
Page 108
Section 5 Debugging [Step Over option] combo box [Flash memory write after download] group box [Parallel] group box [Short break] group box Rev. 12.00 Aug. 28, 2009 Page 88 of 188 REJ10J1140-1200 Enables or disables programming of the flash memory ...
Page 109
Notes: 1. This function is supported by the H8SX family. 2. The range of frequency for the JTAG clock differs depending on the supported device. 3. The H8S family supports the optional Step Over function. When ...
Page 110
Section 5 Debugging 5.2 Downloading a Program This section describes how to download a program and view it as source code or assembly- language mnemonics. Note: After a break has been detected, the High-performance Embedded Workshop displays the location of ...
Page 111
Viewing the Source Code Select a source file name in the [Workspace] window and click [Open] in the popup menu to make the High-performance Embedded Workshop display the source file in the editor also possible to display ...
Page 112
Section 5 Debugging In this window, the following items are shown on the left as line information. The first column (Line number column): Source-line information The second column (Source address column): Address information The third column (Event column): Event information ...
Page 113
S/W breakpoint column S/W breakpoint column displays the following items bookmark is set breakpoint is set location To switch off a column in all source files 1. Click the right-hand mouse button on the ...
Page 114
Section 5 Debugging 5.2.3 Viewing the Assembly-Language Code If there is an address at the cursor position in the [Editor] window, selecting [Go to Disassembly] in the pop-up menu opens the [Disassembly] window. The first address displayed in the [Disassembly] ...
Page 115
Modifying the Assembly-Language Code You can modify the assembly-language code by double-clicking on the instruction that you want to change. The [Assembler] dialog box will be opened. The address, instruction code, and mnemonic are displayed. Enter the new instruction ...
Page 116
Section 5 Debugging 5.2.5 Viewing a Specific Address When you are viewing your program in the [Disassembly] window, you may wish to look at another area of your program's code. Rather than scrolling through a lot of code in the ...
Page 117
Using the Event Points The emulator has the event point function that performs breaking by specifying higher-level conditions along with the PC breakpoints standard for the High-performance Embedded Workshop. 5.3.1 PC Breakpoints When the instruction of the specified address ...
Page 118
Section 5 Debugging 5.3.4 Setting PC Breakpoints It is possible to display, modify, and add PC breakpoints on the [Breakpoint] sheet. Figure 5.8 [Event] Window ([Breakpoint] Sheet) This window displays and sets the breakpoints. Items that can be displayed in ...
Page 119
Add Sets breakpoints. Clicking this item will open the [Set Break] dialog box and break conditions can be specified. 5.3.6 Edit Only enabled when one breakpoint is selected. Select a breakpoint to be edited and click this item. The ...
Page 120
Section 5 Debugging 5.3.12 [Set Break] Dialog Box This dialog box specifies break conditions. A breakpoint address to be set is specified in the [Address] edit box. The PC register can also be specified such as #PC 255 ...
Page 121
During step execution, a software breakpoint is disabled condition set at Break Condition 1 is disabled immediately after starting execution when an instruction at a software breakpoint is executed. A break does not occur even if a ...
Page 122
Section 5 Debugging 5.3.13 Setting Break Conditions On the [Breakcondition] sheet, the settings for break conditions are displayed, modified, and added. Figure 5.10 [Event] Window ([Breakcondition] Sheet) Note: The items that can be set in this window differ depending on ...
Page 123
Operation of the emulator when a break condition is satisfied Break: Breaks program execution When a Break condition 1 is double-clicked in this window, the [Break condition 1] dialog box is opened and break conditions can be modified. For ...
Page 124
Section 5 Debugging 5.3. Source Only enabled when one break channel is selected. Opens the [Editor] window at address of break channel address value has not been set to the break channel, this option cannot be ...
Page 125
Deleting Break Conditions Select a break condition and choose [Delete] from the popup menu to remove the selected break condition. To retain the break condition but not have it cause an event when its conditions are met, use the ...
Page 126
Section 5 Debugging 5.3.28 [Break condition 1] Dialog Box Figure 5.11 [Break condition 1] Dialog Box (H8S) This page sets the address bus, data bus, and read/write cycle conditions. Note: The items that can be set in this dialog box ...
Page 127
The [Address] group box sets address bus conditions. Option [Don’t care] check box [Address] radio button [Only program fetched address after] radio button [Address] edit box [Mask] edit box The contents of an option that can be will change depending ...
Page 128
Section 5 Debugging Figure 5.12 [Break condition 1] Dialog Box (H8SX) This page sets the address bus, data bus, and read/write cycle conditions. Note: The items that can be set in this dialog box differ depending on the MCU. For ...
Page 129
The [Address] group box sets address bus conditions. Option [Don’t care] check box [Address] radio button [Only program fetched address] radio button [Only program fetched address after] radio button [Address] edit box [Non user mask] radio button [User mask] radio ...
Page 130
Section 5 Debugging The [Data] group box sets the data bus conditions. Option [Don’t care] check box [Value] edit box [Byte] radio button [Word] radio button [Long] radio button [Non user mask] radio button [Mask enabled] radio button [Mask] edit ...
Page 131
Viewing the Trace Information For the description on the trace function, refer to section 2.2, Trace Functions. 5.4.1 Opening the [Trace] Window To open the [Trace] window, choose [View -> Code -> Trace] or click the [Trace] toolbar button ...
Page 132
Section 5 Debugging This window displays the following trace information items: [PTR] Pointer to a location in the trace buffer (+0 for the last executed instruction) [IP] The amount of acquired trace information [Type] Type of branch: BRANCH: branch source ...
Page 133
Viewing the [Editor] Window The [Editor] window corresponding to the selected trace record can be displayed in the following two ways: • Select a trace record and choose [View Source] from the popup menu. • Double-click a trace record ...
Page 134
Section 5 Debugging Figure 5.15 [Start/Stop Function Setting] Dialog Box The [Start/Stop Function Setting] dialog box contains the following options. [Run the specified routine just before the user program execution is started.] checkbox : [Run the specified routine just after ...
Page 135
Specifying the Routine to be Executed It is possible to specify the respective routines immediately before starting and immediately after halting the user program execution. When the [The specified routine is executed immediately before execution of the user’s program.] ...
Page 136
Section 5 Debugging Note: When parallel access is enabled and memory access is disabled, the user routine is not executed. • The device groups listed below do not support this function. ⎯ -H8S/2118 device group ⎯ -H8S/2378 device group ⎯ ...
Page 137
Figure 5.17 [Driver Details] Dialog Box (1) Section 5 Debugging Rev. 12.00 Aug. 28, 2009 Page 117 of 188 REJ10J1140-1200 ...
Page 138
Section 5 Debugging Select [Renesas E-Series USB Driver] from the [Driver] drop-down list box and open the [Channel] drop-down list box. Channel information for two emulators is displayed in the [Channel] drop-down list box as shown in figure 5.18. Figure ...
Page 139
When initiating the master High-performance Embedded Workshop, in the [Channel] drop-down list box, select the information on the USB connector of the emulator that is connected to the master CPU. Initiate the High-performance Embedded Workshop using the normal procedures. When ...
Page 140
Section 5 Debugging 5.7 Saving of Hardware-Break Settings 5.7.1 Saving and Loading Hardware-Break Settings This facility allows you to save or load hardware-break settings, i.e. the "Break condition" settings for all channels shown on the [Breakcondition] sheet of the [Eventpoints] ...
Page 141
Figure 5.20 [Load Break condition] Dialog Box Select a file name from the [File name] combo box. If you wish to specify a file that is not included in the list, click on the [ [Load] button loads the settings. ...
Page 142
Section 5 Debugging Rev. 12.00 Aug. 28, 2009 Page 122 of 188 REJ10J1140-1200 ...
Page 143
Introduction This section describes the main functions of the emulator by using a tutorial program. The explanation of the tutorial program will be given in this section using the H8S device. When the H8SX device is used, the displays ...
Page 144
Section 6 Tutorial 6.4 Setting the [Configuration] Dialog Box Select [Emulator] then [Systems…] from the [Setup] menu for the basic settings of the emulator. The [Configuration] dialog box is displayed. Note: The items that can be set in this dialog ...
Page 145
Set options as follows: Table 6.1 [General] Page Options Option Device Emulation mode Step option JTAG clock Flash memory synchronization when the user program is stopped Step Over option Flash memory write after download Short break Note: The range of ...
Page 146
Section 6 Tutorial 6.5 Checking the Operation of RAM Check that RAM is operating correctly. Display and edit the contents of the memory in the [Memory] window to check that the memory is operating correctly. Note: The memory can be ...
Page 147
Placing the mouse cursor on a point in the display of data in the [Memory] window and double- clicking allows the values at that point to be changed. Data can also be directly edited around the current position of ...
Page 148
Section 6 Tutorial 6.6 Downloading the Tutorial Program 6.6.1 Downloading the Tutorial Program Download the object program to be debugged. In this emulator enabled to download the program and set the PC breakpoint in the internal flash memory ...
Page 149
Displaying the Source Program The High-performance Embedded Workshop allows the user to debug a user program at the source level. • Double-click [tutorial.cpp] under [C++ source file]. Figure 6.5 [Editor] Window (Displaying the Source Program) • Select the [Display] ...
Page 150
Section 6 Tutorial 6.7 Setting a PC Breakpoint A PC breakpoint is a simple debugging function. The [Editor] window provides a very simple way of setting a PC breakpoint at any point in a program. For example, to set a ...
Page 151
Setting Registers Set values of the program counter and the stack pointer before executing the program. • Select [Registers] from the [CPU] submenu of the [View] menu. The [Register] window is displayed. Figure 6.7 [Register] Window Rev. 12.00 Aug. ...
Page 152
Section 6 Tutorial • To change the value of the program counter (PC), double-click the value area in the [Register] window with the mouse. The following dialog box is then displayed, and the value can be changed. Set the program ...
Page 153
Executing the Program Execute the program as described in the following: • To execute the program, select [Go] from the [Debug] menu, or click the [Go] button on the toolbar. When the program execution is started, ‘**RUNNING’ is displayed ...
Page 154
Section 6 Tutorial Figure 6.10 [Editor] Window (Break State) Rev. 12.00 Aug. 28, 2009 Page 134 of 188 REJ10J1140-1200 ...
Page 155
The user can see the cause of the break that occurred last time in the [Status] window. • Select [Status] from the [CPU] submenu of the [View] menu. After the [Status] window is displayed, open the [Platform] sheet, and check ...
Page 156
Section 6 Tutorial 6.10 Reviewing Breakpoints The user can see all the breakpoints set in the program in the [Event] window. • Select [Eventpoints] from the [Code] submenu of the [View] menu. The [Event] window is displayed. Select the [Breakpoint] ...
Page 157
Viewing Memory When the label name is specified, the user can view the memory contents that the label has been registered in the [Memory] window. For example, to view the memory contents corresponding to _main in word size: • ...
Page 158
Section 6 Tutorial • Click the [OK] button. The [Memory] window showing the specified area of memory is displayed. Rev. 12.00 Aug. 28, 2009 Page 138 of 188 REJ10J1140-1200 Figure 6.14 [Memory] Window ...
Page 159
Watching Variables As the user steps through a program possible to watch that the values of variables used in the user program are changed. For example, set a watch on the long-type array a declared at the ...
Page 160
Section 6 Tutorial • Click the [Add] button to add a variable to the [Watch] window. Figure 6.16 [Watch] Window (Displaying the Array) Rev. 12.00 Aug. 28, 2009 Page 140 of 188 REJ10J1140-1200 ...
Page 161
The user can also add a variable to the [Watch] window by specifying its name. • Click the [Watch] window with the right-hand mouse button and select [Add Watch…] from the popup menu. The following dialog box will be displayed. ...
Page 162
Section 6 Tutorial The user can click mark ‘+’ at the left side of array a in the [Watch] window to watch all the elements. Figure 6.19 [Watch] Window (Displaying Array Elements) Rev. 12.00 Aug. 28, 2009 Page 142 of ...
Page 163
Stepping Through a Program The High-performance Embedded Workshop provides a range of step menu commands that allow efficient program debugging. Table 6.2 Step Option Menu Command Description Step In Executes each statement, including statements within functions. Step Over Executes ...
Page 164
Section 6 Tutorial • The highlighted line moves to the first statement of the sort function in the [Editor] window. Rev. 12.00 Aug. 28, 2009 Page 144 of 188 REJ10J1140-1200 Figure 6.21 [Editor] Window (Step In) ...
Page 165
Executing [Step Out] Command The [Step Out] command steps out of the called function and stops at the next statement of the calling statement in the main function. • To step out of the sort function, select [Step Out] ...
Page 166
Section 6 Tutorial The data of variable a displayed in the [Watch] window is sorted in ascending order. 6.13.3 Executing [Step Over] Command The [Step Over] command executes a function call as a single step and stops at the next ...
Page 167
Figure 6.25 [High-performance Embedded Workshop] Window (Step Over) Section 6 Tutorial Rev. 12.00 Aug. 28, 2009 Page 147 of 188 REJ10J1140-1200 ...
Page 168
Section 6 Tutorial 6.14 Forced Breaking of Program Executions The High-performance Embedded Workshop can force a break in the execution of a program. • Cancel all breakpoints settings. • To execute the remaining sections of the main function, select [Go] ...
Page 169
Displaying Local Variables The user can display local variables in a function using the [Locals] window. For example, we will examine the local variables in the main function, which declares four local variables and p_sam. • ...
Page 170
Section 6 Tutorial 6.16 Break Function The emulator has PC and hardware break functions. With the High-performance Embedded Workshop breakpoint can be set using the [Breakpoint] sheet of the [Event] window, and a hardware break condition can be ...
Page 171
Double-click the [S/W breakpoint] column on the [Editor] window breakpoint is set. Figure 6.30 [Editor] Window (Setting a PC Breakpoint) Section 6 Tutorial Rev. 12.00 Aug. 28, 2009 Page 151 of 188 REJ10J1140-1200 ...
Page 172
Section 6 Tutorial • When the PC breakpoint is set in the [Event] window, click the [Event] window with the right- hand mouse button and select [Add…] from the popup menu. • Click the [OK] button. Note: The address values ...
Page 173
The PC breakpoint that has been set is displayed in the [Event] window. Figure 6.32 [Event] Window (PC Breakpoint Setting) Note: The items that can be displayed in this window differ according to the product. For the items that can ...
Page 174
Section 6 Tutorial The program runs, and stops at the set PC breakpoint. Figure 6.33 [Editor] Window at Execution Stop (PC Break) Rev. 12.00 Aug. 28, 2009 Page 154 of 188 REJ10J1140-1200 ...
Page 175
The [Status] window displays the following contents. Figure 6.34 Displayed Contents of the [Status] Window (PC Break) Note: The items that can be displayed in this window differ depending on the product. For the items that can be displayed, refer ...
Page 176
Section 6 Tutorial 6.17 Hardware Break Function A method is given below in which the address bus condition is set under Break Condition 1 as hardware break conditions. • Select [Eventpoints] from the [Code] submenu of the [View] menu. The ...
Page 177
Figure 6.35 [High-performance Embedded Workshop] Window ([Break condition 1]) • The [Break condition 1] dialog box is displayed. • The data condition can be set besides the address condition. Section 6 Tutorial Rev. 12.00 Aug. 28, 2009 Page 157 of ...
Page 178
Section 6 Tutorial Figure 6.36 [condition] Page ([Break condition 1] Dialog Box) • Click the [OK] button. • The content that has been set is reflected in the [Event] window. • The first point display in the State line changes ...
Page 179
The program runs and then stops at the condition specified under Break Condition 1. Figure 6.37 [Editor] Window at Execution Stop (Break Condition 1) Section 6 Tutorial Rev. 12.00 Aug. 28, 2009 Page 159 of 188 REJ10J1140-1200 ...
Page 180
Section 6 Tutorial The [Status] window displays the following contents. Figure 6.38 Displayed Contents of the [Status] Window (Break Condition 1) Note: The items that can be displayed in this window differ depending on the product. For the items that ...
Page 181
Trace Functions The emulator has a branch-instruction trace function. In H8S family, the four-channel branch source addresses, mnemonics, operands, source lines, and labels are displayed. In H8SX family, the eight-channel branch source or destination addresses, mnemonics, operands, source lines, ...
Page 182
Section 6 Tutorial 6.19 Stack Trace Function The emulator uses the information on the stack to display the names of functions in the sequence of calls that led to the function to which the program counter is currently pointing. Note: ...
Page 183
After the break in program execution, select [Stack Trace] from the [Code] submenu of the [View] menu to open the [Stack Trace] window. Figure 6.41 shows that the position of the program counter is currently at the selected line ...
Page 184
Section 6 Tutorial Rev. 12.00 Aug. 28, 2009 Page 164 of 188 REJ10J1140-1200 ...
Page 185
Section 7 Maintenance and Guarantee This section describes maintenance, guarantee, repair provisions, and how to request for repair of the emulator. 7.1 User Registration When you purchase our product, be sure to register as a user. For user registration, refer ...
Page 186
Section 7 Maintenance and Guarantee 7.4 Repair Provisions 7.4.1 Repair with Extra-Charge The products elapsed more than one year after purchase can be repaired with extra-charge. 7.4.2 Replacement with Extra-Charge If your product's fault falls in any of the following ...
Page 187
How to Make a Request for Repair If your product is found faulty, follow the procedure below to send your product for repair. Fill in the Repair Request Sheet included with this product, then send it along with this ...
Page 188
Section 7 Maintenance and Guarantee Rev. 12.00 Aug. 28, 2009 Page 168 of 188 REJ10J1140-1200 ...
Page 189
Appendix A Troubleshooting 1. I have a text file open in the editor but syntactic color-coding is not being displayed. Ensure that you have named the file (i.e. saved it) and that the “Syntax coloring” check box is set on ...
Page 190
Appendix A Troubleshooting Rev. 12.00 Aug. 28, 2009 Page 170 of 188 REJ10J1140-1200 ...
Page 191
Appendix B Window Functions This section describes the window functions that can be used with the E10A-USB emulator High- performance Embedded Workshop. Here, the High-performance Embedded Workshop common functions are omitted, and only the emulation functions are described. Table B.1 ...
Page 192
Appendix B Window Functions Table B.1 Window Functions (cont) Menu Option View Code Eventpoints (cont) Trace Stack Trace Gra- Image… phic Waveform… Setup Radix Hexadecimal Decimal Octal Binary Emu- System… lator Start/Stop Function Settings… Save Break condition … Load Break ...
Page 193
Table B.1 Window Functions (cont) Menu Option Debug Debug Sessions… Debug Settings… Reset CPU Go Reset Cursor Set PC To Cursor Display PC Run… Step In Step Over Step Out Toolbar Shortcut Button Remarks Opens the [Debug ...
Page 194
Appendix B Window Functions Table B.1 Window Functions (cont) Menu Option Debug Step… Step Auto Mode Assembly Source Halt Program Connect Initialize Disconnect Download Modules Unload Modules Rev. 12.00 Aug. 28, 2009 Page 174 of 188 REJ10J1140-1200 Toolbar Shortcut Button ...
Page 195
Appendix C Command-Line Functions The emulator supports the commands that can be used in the command-line window. For details, refer to the online help. Appendix C Command-Line Functions Rev. 12.00 Aug. 28, 2009 Page 175 of 188 REJ10J1140-1200 ...
Page 196
Appendix C Command-Line Functions Rev. 12.00 Aug. 28, 2009 Page 176 of 188 REJ10J1140-1200 ...
Page 197
Appendix D Notes on High-performance Embedded 1. Note on Moving Source File Position after Creating Load Module When the source file is moved after creating the load module, the [Open] dialog box may be displayed to specify the source file ...
Page 198
Appendix D Notes on High-performance Embedded Workshop ⎯ Variable name specification When a name other than a variable name, such as a symbol name or function name, is specified, no data is displayed. Example: 5. Line Assembly ⎯ Input radix ...
Page 199
Window ⎯ Display and modification Do not change values in the [I/O Registers] window because the emulator uses the address break controller. Note that the emulator does not support the display of the invalid module or bit information ...
Page 200
Appendix D Notes on High-performance Embedded Workshop 15. Support of Double Float Format In the following memory operations, the double float format is not supported: ⎯ [Fill Memory] dialog box ⎯ [Search Memory] dialog box ⎯ MEMORY_FILL command The [Length] ...