ATICE50PROBE Atmel, ATICE50PROBE Datasheet - Page 56
ATICE50PROBE
Manufacturer Part Number
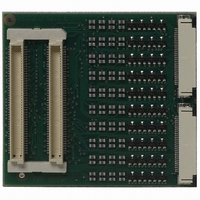
ATICE50PROBE
Description
PROBE ICE50 W/FLEX CABLES
Manufacturer
Atmel
Datasheet
1.ATICE50MEM.pdf
(73 pages)
Specifications of ATICE50PROBE
Accessory Type
Probe with Flex Cables
For Use With/related Products
AVR ICE 50
Lead Free Status / RoHS Status
Contains lead / RoHS non-compliant


2523A–AVR–11/02
Trace
7.2
7-2
The Trace
Window
Figure 7-3. Multiple Start and Stop Trace
The Function ID numbers can be selected from the trace toolbar. In Figure 7-4 Function
ID “2” is selected from a drop down menu.
Figure 7-4. Function ID Selection
4. Open Trace Window.
To view the Trace output, select “Trace Output” from the view menu or press the trace
window icon in the trace toolbar. The trace window icon is located as number three from
the right in Figure 7-5.
Figure 7-5. Trace Output
A window like illustrated in Figure 7-6 will appear on the screen. The contents of the
trace buffer will of course vary with the actual project.
Figure 7-6. Trace Buffer
The Trace function of the ICE50 traces the program execution every clock cycle trace
every single cycle in the execution.
The Trace view contains the columns described below. A more detailed description of
the contents of each column for the individual AVR instruction is found in the section:
Contents of Trace Window based on Instruction.
Timestamp Column: This column contains the value of the Cycle Counter at the time
when the information was logged. Note that the Cycle Counter has 41 bits so it will
wrap at a value of 0x20000000000 or 2199023255552d .
If executing with a clock frequency of 20 MHz, this means that the Cycle Counter will
wrap every 30 hours.
Program Memory Address column (Ins Addr): This column contains the current value
ICE50 User Guide
Related parts for ATICE50PROBE
Image
Part Number
Description
Manufacturer
Datasheet
Request
R

Part Number:
Description:
EMULATOR IN CIRCUIT MEGAAVR
Manufacturer:
Atmel
Datasheet:

Part Number:
Description:
DEV KIT FOR AVR/AVR32
Manufacturer:
Atmel
Datasheet:

Part Number:
Description:
INTERVAL AND WIPE/WASH WIPER CONTROL IC WITH DELAY
Manufacturer:
ATMEL Corporation
Datasheet:
Part Number:
Description:
Low-Voltage Voice-Switched IC for Hands-Free Operation
Manufacturer:
ATMEL Corporation
Datasheet:
Part Number:
Description:
MONOLITHIC INTEGRATED FEATUREPHONE CIRCUIT
Manufacturer:
ATMEL Corporation
Datasheet:
Part Number:
Description:
AM-FM Receiver IC U4255BM-M
Manufacturer:
ATMEL Corporation
Datasheet:
Part Number:
Description:
Monolithic Integrated Feature Phone Circuit
Manufacturer:
ATMEL Corporation
Datasheet:
Part Number:
Description:
Multistandard Video-IF and Quasi Parallel Sound Processing
Manufacturer:
ATMEL Corporation
Datasheet:
Part Number:
Description:
High-performance EE PLD
Manufacturer:
ATMEL Corporation
Datasheet:
Part Number:
Description:
8-bit Flash Microcontroller
Manufacturer:
ATMEL Corporation
Datasheet:
Part Number:
Description:
2-Wire Serial EEPROM
Manufacturer:
ATMEL Corporation
Datasheet: