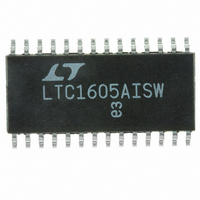
LTC1605AISW#PBF Linear Technology, LTC1605AISW#PBF Datasheet - Page 5

LTC1605AISW#PBF
Manufacturer Part Number
LTC1605AISW#PBF
Description
IC A/D CONV 16BIT SAMPLNG 28SOIC
Manufacturer
Linear Technology
Datasheet
1.LTC1605INPBF.pdf
(16 pages)
Specifications of LTC1605AISW#PBF
Number Of Bits
16
Sampling Rate (per Second)
100k
Data Interface
Parallel
Number Of Converters
1
Power Dissipation (max)
80mW
Voltage Supply Source
Analog and Digital
Operating Temperature
-40°C ~ 85°C
Mounting Type
Surface Mount
Package / Case
28-SOIC (0.300", 7.50mm Width)
Number Of Elements
1
Resolution
16Bit
Architecture
SAR
Sample Rate
100KSPS
Input Polarity
Bipolar
Input Type
Voltage
Rated Input Volt
±10V
Differential Input
No
Power Supply Requirement
Analog and Digital
Single Supply Voltage (typ)
5V
Single Supply Voltage (min)
4.75V
Single Supply Voltage (max)
5.25V
Dual Supply Voltage (typ)
Not RequiredV
Dual Supply Voltage (min)
Not RequiredV
Dual Supply Voltage (max)
Not RequiredV
Power Dissipation
80mW
Differential Linearity Error
1LSB
Integral Nonlinearity Error
±2LSB
Operating Temp Range
-40C to 85C
Operating Temperature Classification
Industrial
Mounting
Surface Mount
Pin Count
28
Package Type
SOIC W
Input Signal Type
Single-Ended
Lead Free Status / RoHS Status
Lead free / RoHS Compliant
Available stocks
Company
Part Number
Manufacturer
Quantity
Price
ELECTRICAL CHARACTERISTICS
Note 8: Bipolar offset is the offset voltage measured from – 0.5 LSB when
the output code flickers between 0000 0000 0000 0000 and 1111 1111
1111 1111.
Note 9: Guaranteed by design, not subject to test.
Note 10: Recommended operating conditions.
Note 11: With CS low the falling R/C edge starts a conversion. If R/C
returns high at a critical point during the conversion it can create small
errors. For best results ensure that R/C returns high within 3µs after the
start of the conversion.
Note 12: As measured with fixed resistors shown in Figure 4. Adjustable to
zero with external potentiometer.
TYPICAL PERFORMANCE CHARACTERISTICS
12.5
12.0
11.5
11.0
10.5
10.0
–0.5
–1.0
–1.5
–2.0
9.5
2.0
1.5
1.0
0.5
0
4.50
0
Typical INL Curve
Supply Current vs Supply Voltage
f
SAMPLE
16384
4.75
= 100kHz
SUPPLY VOLTAGE (V)
32768
CODE
5.00
49152
5.25
W
1605 • TPC01
1605 • TPC04
65535
U
5.50
12.0
11.5
11.0
10.5
10.0
–0.5
–1.0
–1.5
–2.0
2.0
1.5
1.0
0.5
0
–50
Supply Current vs Temperature
Typical DNL Curve
0
f
SAMPLE
–25
16384
= 100kHz
TEMPERATURE (°C)
0
32768
CODE
25
Note 13: Full-scale error is the worst-case of –FS or +FS untrimmed
deviation from ideal first and last code transitions, divided by the transition
voltage (not divided by the full-scale range) and includes the effect of
offset error.
Note 14: All specifications in dB are referred to a full-scale ±10V input.
Note 15: Full-power bandwidth is defined as full-scale input frequency at
which a signal-to-(noise + distortion) degrades to 60dB or 10 bits of
accuracy.
Note 16: Recovers to specified performance after (2 • FS) input
overvoltage.
50
49152
75
1605 • TPC02
1605 • TPC05
65535
100
–20
–30
–40
–50
–60
–70
–10
–20
–30
–40
–50
50
40
30
20
10
0
–25
1
Change in CAP Voltage vs
Load Current
Power Supply Feedthrough vs
Ripple Frequency
10
–15
RIPPLE FREQUENCY (Hz)
LOAD CURRENT (mA)
100
–5
1k
LTC1605
5
10k
15
100k
1605 • TPC06
1605 TPC03
1605fc
5
1M
25


