1132A AGILENT TECHNOLOGIES, 1132A Datasheet - Page 13
1132A
Manufacturer Part Number
1132A
Description
TEST PROBE, OSCILLOSCOPE
Manufacturer
AGILENT TECHNOLOGIES
Datasheet
1.E2609B.pdf
(45 pages)
Specifications of 1132A
Test Probe Type
Oscilloscope
Test Probe Functions
High Frequency
Accuracy
± 3%
For Use With
Infiniium Series Oscilliscopes
Lead Free Status / RoHS Status
na


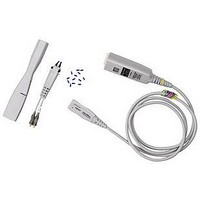
High-Frequency Active Differential/Single-Ended Probe System
Agilent 1130A/31A/32A/34A InfiniiMax High-Performance Active Probe System
Specifications
Operating Characteristics
Probe bandwidth*
Rise and fall time (10% to 90%)
System bandwidth (–3 dB)
Input capacitance**
Input resistance*
Input dynamic range
Input common mode range
Maximum signal slew rate
DC attenuation
Zero offset error referred
to input
Offset range*
Offset accuracy
Noise referred to input
Propagation delay
Maximum input voltage*
ESD tolerance
* Denotes warranted specifications, all others are typical.
** Measured using the probe amplifier and solder-in differential probe head with full bandwidth resistors.
1134A: > 7 GHz
1132A: > 5 GHz
1131A: > 3.5 GHz
1130A: > 1.5 GHz
1134A: 60 psec
1132A: 86 psec
1131A: 100 psec
1130A: 233 psec
1134A with 54855A: 6 GHz
1132A with 54854A: 4 GHz
1131A with 54853A: 2.5 GHz
1131A with 54852A: 2 GHz
1130A with MSO/DSO8104A, 54832B/D, 33A/D: 1 GHz
Cm = 0.1 pF Cm is between tips.
Cg = 0.34 pF Cg is to ground for each tip.
Cdiff = 0.27pF Differential mode capacitance = Cm + Cg/2
Cse = 0.44 pF Singe-ended mode capacitance = Cm + Cg
Differential mode resistance = 50 kΩ ± 1%
Single-ended mode resistance = 25 kΩ ± 1%
±2.5 V
±6.75 V dc to 100 Hz; ±1.25 V >100 Hz
18 V/ns when probing a single-ended signal
30 V/ns when probing a differential signal
10:1 ± 3% before calibration on oscilloscope
10:1 ± 1% after calibration on oscilloscope
< 30 mV before calibration on oscilloscope
< 5 mV after calibration on oscilloscope
± 12.0 V when probing single-ended
< 3 % setting before calibration on oscilloscope
< 1 % setting after calibration on oscilloscope
3.0 mVrms
~6 nsec (This delay can be deskewed relative to
other signals.)
30 Vpeak, CAT I
> 8 kV from 100 pF, 300 Ω HBM
dB
dB
Example of characterized
performance plots: differential
solder-in probe head
Figure 3.5. Common mode rejection
vs. frequency.
Figure 3.4. Swept frequency response.
-12
-10
-20
-30
-40
-50
-60
-3
-6
-9
0
6
3
0
10
10
8
8
Frequency (Hz)
Frequency (Hz)
10
10
9
9
10
10
10
10
13