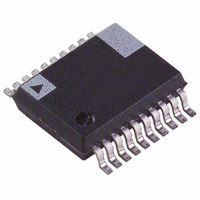
ADE7760ARSRL Analog Devices Inc, ADE7760ARSRL Datasheet - Page 19

ADE7760ARSRL
Manufacturer Part Number
ADE7760ARSRL
Description
IC ENERGY METER W/OCFD 20SSOP TR
Manufacturer
Analog Devices Inc
Datasheet
1.ADE7760ARS.pdf
(24 pages)
Specifications of ADE7760ARSRL
Rohs Status
RoHS non-compliant
Input Impedance
400 KOhm
Measurement Error
0.1%
Voltage - I/o High
2.4V
Voltage - I/o Low
0.8V
Current - Supply
4mA
Voltage - Supply
4.75 V ~ 5.25 V
Operating Temperature
-40°C ~ 85°C
Mounting Type
Surface Mount
Package / Case
20-SSOP (0.200", 5.30mm Width)
Meter Type
Single Phase
Lead Free Status / Rohs Status
Not Compliant
APPLICATIONS
INTERFACING TO A MICROCONTROLLER FOR
ENERGY MEASUREMENT
The easiest way to interface the ADE7760 to a microcontroller
is to use the CF high frequency output with the output fre-
quency scaling set to 2048 × F1, F2. This is done by setting
SCF = 0 and S0 = S1 = 1 (see Table 7). With full-scale ac signals
on the analog inputs, the output frequency on CF is approxi-
mately 5.5 kHz. Figure 26 illustrates one scheme that could be
used to digitize the output frequency and carry out the
necessary averaging mentioned in the previous section.
As shown, the frequency output CF is connected to an MCU
counter or port, which counts the number of pulses in a given
integration time, determined by an MCU internal timer. The
average power, proportional to the average frequency, is given
by
The energy consumed during an integration period is given by
FREQUENCY
**FAULT MUST BE USED TO RECORD ENERGY IN FAULT CONDITION.
Average
Energy
*REVP MUST BE USED IF THE METER IS BIDIRECTIONAL OR
DIRECTION OF ENERGY FLOW IS NEEDED.
AVERAGE
ADE7760
FAULT**
CF
=
REVP*
Frequency
Average
Figure 26. Interfacing the ADE7760 to an MCU
CF
Power
=
Average
FREQUENCY
RIPPLE
×
TIME
Time
Active
=
Counter
UP/DOWN
Time
Power
COUNTER
LOGIC
MCU
×
=
Time
Counter
Timer
±10%
=
Counter
Rev. 0 | Page 19 of 24
For the purpose of calibration, this integration time could be
10 s to 20 s in order to accumulate enough pulses to ensure
correct averaging of the frequency. In normal operation, the
integration time could be reduced to 1 s or 2 s depending, for
example, on the required update rate of a display. With shorter
integration times on the MCU, the amount of energy in each
update might still have a small amount of ripple, even under
steady load conditions. However, over a minute or more, the
measured energy has no ripple.
SELECTING A FREQUENCY FOR AN ENERGY
METER APPLICATION
As shown in Table 5, the user can select one of four frequencies.
This frequency selection determines the maximum frequency
on F1 and F2. These outputs are intended to be used to drive the
energy register (electromechanical or other). Because only four
different output frequencies can be selected, the available
frequency selection has been optimized for a meter constant of
100 impulses/kWh with a maximum current of between 10 A
and 120 A. Table 8 shows the output frequency for several
maximum currents (I
cases, the meter constant is 100 impulses/kWh.
Table 8. F1 and F2 Frequency at 100 Impulses/kWh
I
12.5 A
25 A
40 A
60 A
80 A
120 A
The F
output frequencies on F1 and F2. When designing an energy
meter the nominal design voltage on Channel 2 (voltage)
should be set to half-scale to allow for calibration of the meter
constant. The current channel should also be no more than half-
scale when the meter sees maximum load. This accommodates
overcurrent signals and signals with high crest factors. Table 9
shows the output frequency on F1 and F2 when both analog
inputs are half-scale. The frequencies listed in Table 9 align well
with those listed in Table 8 for maximum load.
MAX
1–4
frequencies allow complete coverage of this range of
MAX
F1 and F2 (Hz)
0.083
0.166
0.266
0.4
0.533
0.8
) with a line voltage of 240 V. In all
ADE7760


