AD8369-EVAL Analog Devices Inc, AD8369-EVAL Datasheet - Page 20
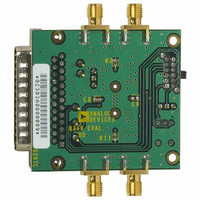
AD8369-EVAL
Manufacturer Part Number
AD8369-EVAL
Description
BOARD EVAL FOR AD8369
Manufacturer
Analog Devices Inc
Datasheet
1.AD8369-EVAL.pdf
(24 pages)
Specifications of AD8369-EVAL
Lead Free Status / RoHS Status
Contains lead / RoHS non-compliant


AD8369
APPENDIX
Characterization Equipment
Two sets of automated characterization equipment were used to
obtain the majority of the information contained in this data sheet.
An Agilent N4441A Balanced Measurement System was used to
obtain the gain, phase, group delay, reverse isolation, CMRR,
and s-parameter information. Except for the s-parameter informa-
tion, T-attenuator pads were used to match the 50 W impedance of
the ports of this instrument to the AD8369.
An Anritsu MS4623B “Scorpion” Vector Network Analyzer was
used to obtain nonlinear measurements IMD
through matching baluns and attenuator networks.
Definitions of Selected Parameters
Common-mode rejection ratio (TPC 14) has been defined for
this characterization effort as:
where the numerator is the gain into a differential load at the
output due to a differential source at the input and the denomina-
tor is the gain into a common-mode load at the output due to a
common-mode source at the input. In terms of mixed-mode
s-parameters, this equates to:
Reverse isolation (TPC 17) is defined as SDD12.
More information on mixed-mode s-parameters can be obtained
in the a reference by Bockelman, D.E. and Eisenstadt, W.R.,
Combined Differential and Common-Mode Scattering Parameters:
Theory and Simulation. IEEE Transactions on Microwave Theory
and Techniques, v 43, n 7, 1530 (July 1995).
Differential Mode forwardgain
Common Mode forwardgain
69.8
69.8
-
-
SDD
SCC
69.8
69.8
V
S
21
21
,
,
10nF
10nF
0.1 F
Figure 12. Balanced Measurement System Setup
INLO
INHI COMM
16
1
R
3
L
, IP3, and P1dB
10nF
PORT1
PORT3
COMM BIT0
15
2
PWUP VPOS SENB
14
3
(ALL PORTS 50 )
AGILENT N4441A
BIT1
AD8369
13
4
BIT2
12
–20–
5
0.1 F
BIT3
FILT CMDC OPHI
Composite Waveform Assumption
The nonlinear two-tone measurements made for this data sheet,
i.e., IMD
composite waveform at the output, generally 1 V p-p. The fre-
quencies of interest dictate the use of RF test equipment and
because this equipment is generally not designed to work in
units of volts, but rather watts and dBm, an assumption was
made to simplify equipment setup and operation.
Two sinusoidal tones can be represented as:
The average voltage of one tone is:
where T is the period of the waveform. The average voltage of the
two-tone composite signal is:
So each tone contributes 1/÷2 to the average composite ampli-
tude in terms of voltage. It can be shown that the average
power of this composite waveform is two times greater, or 3dB,
than that of the single tone. This principle can be used to set
correct input amplitudes from generators scaled in dBm and
is correct if the two tones are of equal amplitude and are not
farther than 1 percent apart in frequency.
11
6
1nF
PORT2
PORT4
DENB
CONTROL INTERFACE
10
7
OPLO
3
R
R
and IP3, are based on the assumption of a fixed value
8
9
L
L
= 200
= 1000
10nF
10nF
DIFFERENTIAL: R1 = 69.8 , R2 = 69.8
DIFFERENTIAL: R1 = 475 , R2 = 52.3
R1
R1
T
1
V
V
T
1
2
1
T
0
Ú
T
Ú
0
(
=
=
V
( )
V
1
sin p
sin p
1
+
2
V
R2
R2
(
(
dt
2
2
2
)
2
=
f t
f t
dt
1
2
)
1
)
=
2
1
REV. 0
Related parts for AD8369-EVAL
Image
Part Number
Description
Manufacturer
Datasheet
Request
R

Part Number:
Description:
BOARD EVAL FOR AD8369 LF-600MHZ
Manufacturer:
Analog Devices Inc

Part Number:
Description:
±1.7g Dual-Axis IMEMS Accelerometer Evaluation Board
Manufacturer:
Analog Devices Inc
Datasheet:
Part Number:
Description:
Inertial Sensor Evaluation System
Manufacturer:
Analog Devices Inc
Datasheet:
Part Number:
Description:
Manufacturer:
Analog Devices Inc
Datasheet:
Part Number:
Description:
Manufacturer:
Analog Devices Inc
Datasheet:
Part Number:
Description:
Manufacturer:
Analog Devices Inc
Datasheet:
Part Number:
Description:
Manufacturer:
Analog Devices Inc
Datasheet:
Part Number:
Description:
Manufacturer:
Analog Devices Inc
Datasheet:
Part Number:
Description:
Manufacturer:
Analog Devices Inc
Datasheet:
Part Number:
Description:
Manufacturer:
Analog Devices Inc
Datasheet:
Part Number:
Description:
Manufacturer:
Analog Devices Inc
Datasheet:
Part Number:
Description:
Manufacturer:
Analog Devices Inc
Datasheet:
Part Number:
Description:
Manufacturer:
Analog Devices Inc
Datasheet: