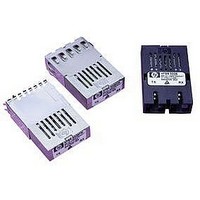
HFBR-5208FM Avago Technologies US Inc., HFBR-5208FM Datasheet - Page 2

HFBR-5208FM
Manufacturer Part Number
HFBR-5208FM
Description
Fiber Optics, Transceiver Module
Manufacturer
Avago Technologies US Inc.
Specifications of HFBR-5208FM
Peak Reflow Compatible (260 C)
No
Leaded Process Compatible
No
Connector Type
SC Duplex
Lead Free Status / RoHS Status
Contains lead / RoHS non-compliant
Transmitter Section
The transmitter section of the HFBR-5208M consists of
a 1300 nm LED in an optical subassembly (OSA) which
mates to the multimode fiber cable. The HFCT-5208M
incorporates a 1300 nm Fabry Perot (FP) laser in the
optical subassembly. In addition, this package has been
designed to be compliant with IEC 825 eye-safety
requirements under any single fault condition. The
OSA’s are driven by a custom, silicon bipolar IC which
converts differential PECL logic signals (ECL referenced
to a +5 V supply) into an analog LED/laser drive current.
Receiver Section
The receiver contains an InGaAs PIN photodiode mounted
together with a custom, silicon bipolar transimpedance
preamplifier IC in an OSA. This OSA is mated to a custom,
silicon bipolar circuit providing post amplification and
quantization and optical signal detection.
The custom, silicon bipolar circuit includes a Signal Detect
circuit which provides a PECL logic high state output upon
detection of a usable input optical signal level. This single-
ended PECL output is designed to drive a standard PECL
input through normal 50 Ω PECL load.
Applications Information
Typical BER Performance of HFBR-5208M Receiver versus
Input Optical Power Level
The HFBR/HFCT-5208M transceiver can be operated at
Bit-Error-Ratio conditions other than the required BER = 1
x 10
Layer Standard and the ANSI T1.646a. The typical trade-off
of BER versus Relative Input Optical Power is shown in
Figure 1. The Relative Input Optical Power in dB is
referenced to the Input Optical Power parameter value in
the Receiver Optical Characteristics table. For better BER
condition than 1 x 10
Figure 1. Relative Input Optical Power -dBm Average.
2
10
10
10
10
10
10
10
10
10
10
10
10
10
10
-10
-10
-11
-12
-13
-14
-15
-2
-3
-4
-5
-6
-7
-8
-9
-5
of the 622 MBd ATM Forum 622.08 Mb/s Physical
-4 -3 -2 -1 0
LINEAR EXTRAPOLATION OF
10
-4
THROUGH 10
-10
ACTUAL DATA
, more input signal is needed (+dB).
-7
DATA
1
2
3
For example, to operate the HFBR-5208M at a BER of 1 x
10
0.6 dB higher than the -26 dBm level required for 1 x 10
operation, i.e. -25.4 dBm.
An informative graph of a typical, short fiber transceiver
link per-formance can be seen in Figure 2. This figure is
useful for designing short reach links with time-based jitter
requirements. This figure indicates Relative Input Optical
Power versus Sampling Time Position within the receiver
output data eye-opening. The given curves are at a constant
bit-error-ratio (BER) of 10
155 MBd, 311 MBd, 622 MBd and 650 MBd. These curves,
called “tub” diagrams for their shape, show
the amount of data eye-opening time-width for various
receiver input optical power levels. A wider data eye-
opening provides more time for the clock recovery circuit
to operate within without creating errors. The deeper the
tub is indicates less input optical power is needed to
operate the receiver at the same BER condition. Generally,
the wider and deeper the tub is the better. The Relative
Input Optical Power amount (dB) is referenced to the
absolute level (dBm avg.) given in the Receiver Optical
Characteristics table. The 0 ns sampling time position for
this Figure 2 refers to the center of the Baud interval for the
particular signaling rate. The Baud interval is the reciprocal
of the signaling rate in MBd. For example, at 622 MBd the
Baud interval is 1.61 ns, at 155 MBd the Baud interval is
6.45 ns. Test conditions for this tub diagram are listed in
Figure 2.
The HFBR/HFCT-5208M receiver input optical power
requirements vary slightly over the signaling rate range of
20 MBd to 700 MBd for a constant bit-error-ratio (BER) of
10
relative input optical power varies by <0.7 dB over this full
range. This small sensitivity variation allows the optical
budget to remain nearly constant for designs that make
use of the broad signaling rate range of the
HFBR/HFCT-5208M. The curve has been normalized to the
input optical power level (dBm avg.) of the receiver for 622
MBd at center of the Baud interval with a BER of 10
data patterns that can be used at these signaling rates
should be, on average, balanced duty factor of 50%.
Momentary excursions of less or more data duty factor
than 50% can occur, but the overall data pattern must
remain balanced. Unbalanced data duty factor will cause
excessive pulse-width distortion, or worse, bit errors. The
test conditions are listed in Figure 3.
-12
-10
, the receiver will require an input signal approximately
condition. Figure 3 illustrates the typical receiver
-10
for four different signaling rates,
-10
. The
-10


