ADXRS150ABG Analog Devices Inc, ADXRS150ABG Datasheet - Page 11
ADXRS150ABG
Manufacturer Part Number
ADXRS150ABG
Description
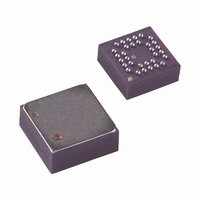
IC GYROSCOPE SGL COND 32CSPBGA
Manufacturer
Analog Devices Inc
Datasheet
1.ADXRS150EB.pdf
(12 pages)
Specifications of ADXRS150ABG
Rohs Status
RoHS non-compliant
Range °/s
±150°/s
Sensitivity
12.5mV/°/s
Typical Bandwidth
40Hz
Voltage - Supply
4.75 V ~ 5.25 V
Current - Supply
6mA
Output Type
Ratiometric
Operating Temperature
-40°C ~ 85°C
Package / Case
32-CSPBGA
For Use With
ADXRS150EB - BOARD EVAL FOR ADXRS150
Available stocks
Company
Part Number
Manufacturer
Quantity
Price
Company:

Part Number:
ADXRS150ABG
Manufacturer:
MICROCHIP
Quantity:
5 700


ACCELERATION SENSITIVITY
The sign convention used is that lateral acceleration is positive
in the direction from Pin Column A to Pin Column G of the
package. That is, a device has positive sensitivity if its voltage
output increases when the row of Pins 2A–6A are tipped under
the row of Pins 2G–6G in the earth’s gravity.
There are two effects of concern, shifts in the static null and
induced null noise. Scale factor is not significantly affected until
the acceleration reaches several hundred m/s
Vibration rectification for frequencies up to 20 kHz is on the
order of 0.00002(°/s)/(m/s
frequency, and has been verified up to 400 m/s
Linear vibration spectral density near the 14 kHz sensor reso-
nance translates into output noise. In order to have a significant
effect, the vibration must be within the angular rate bandwidth
(typically ±40 Hz of the resonance), so it takes considerable
high frequency vibration to have any effect.
Away from the 14 kHz resonance the effect is not discernible,
except for vibration frequencies within the angular rate pass
band. This can be seen in Figure 10 to Figure 15 for the various
sensor axes. The in-band effect can be seen in Figure 25. This is
the result of the static g-sensitivity. The specimen used for
Figure 25 had a g-sensitivity of 0.15°/s/g and its total in-band
noise degraded from 3 mV rms to 5 mV rms for the specified
vibration. The effect of broadband vibration up to 20 kHz is
shown in Figure 24 and Figure 26.
The output noise of the part falls away in accordance with the
output low-pass filter and does not contain any spikes greater
than 1% of the low frequency noise. A typical noise spectrum is
shown in Figure 27.
2.50
2.60
2.56
2.52
2.58
2.54
0
at 0.01 g/√Hz with 60 Hz Sampling and 0.5 sec Averaging
Figure 24. Random Vibration (Lateral) 10 kHz to 20 kHz
2
2
4
)
2
TIME (sec)
, is not significantly dependent on
6
2
.
8
2
rms.
10
Rev. B | Page 11 of 12
–130
–110
–120
–100
2.60
2.56
2.52
2.50
2.60
2.52
2.50
2.58
2.54
2.58
2.56
2.54
–60
–80
–70
–90
Figure 25. Random Vibration (Lateral) 2 Hz to 40 Hz, 3.2 g rms
0
0
0
at 0.01 g/√Hz with 60 Hz Sampling and 0.5 sec Averaging
Figure 27. Noise Spectral Density at RATEOUT –BW = 4 Hz
Figure 26. Random Vibration (Lateral) 10 kHz to 20 kHz
10
2
2
STATIC 0.8mV rms
SHAKING 2.4mV rms
FREQUENCY (Hz)
100
4
4
TIME (sec)
TIME (sec)
1000
6
6
10000
8
8
ADXRS150
100000
10
10
Related parts for ADXRS150ABG
Image
Part Number
Description
Manufacturer
Datasheet
Request
R

Part Number:
Description:
±1.7g Dual-Axis IMEMS Accelerometer Evaluation Board
Manufacturer:
Analog Devices Inc
Datasheet:

Part Number:
Description:
Inertial Sensor Evaluation System
Manufacturer:
Analog Devices Inc
Datasheet:
Part Number:
Description:
Manufacturer:
Analog Devices Inc
Datasheet:
Part Number:
Description:
Manufacturer:
Analog Devices Inc
Datasheet:
Part Number:
Description:
Manufacturer:
Analog Devices Inc
Datasheet:
Part Number:
Description:
Manufacturer:
Analog Devices Inc
Datasheet:
Part Number:
Description:
Manufacturer:
Analog Devices Inc
Datasheet:
Part Number:
Description:
Manufacturer:
Analog Devices Inc
Datasheet:
Part Number:
Description:
Manufacturer:
Analog Devices Inc
Datasheet:
Part Number:
Description:
Manufacturer:
Analog Devices Inc
Datasheet:
Part Number:
Description:
Manufacturer:
Analog Devices Inc
Datasheet:
Part Number:
Description:
Manufacturer:
Analog Devices Inc
Datasheet:
Part Number:
Description:
Manufacturer:
Analog Devices Inc
Datasheet: