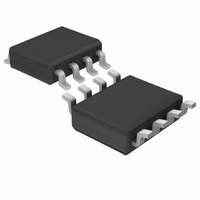
LTC1400CS8 Linear Technology, LTC1400CS8 Datasheet - Page 8

LTC1400CS8
Manufacturer Part Number
LTC1400CS8
Description
IC A/D CONV 12BIT W/SHTDN 8-SOIC
Manufacturer
Linear Technology
Datasheet
1.LTC1400IS8PBF.pdf
(20 pages)
Specifications of LTC1400CS8
Number Of Bits
12
Sampling Rate (per Second)
400k
Data Interface
MICROWIRE™, Serial, SPI™
Number Of Converters
1
Power Dissipation (max)
160mW
Voltage Supply Source
Dual ±
Operating Temperature
0°C ~ 70°C
Mounting Type
Surface Mount
Package / Case
8-SOIC (0.154", 3.90mm Width)
Lead Free Status / RoHS Status
Contains lead / RoHS non-compliant
Available stocks
Company
Part Number
Manufacturer
Quantity
Price
Company:
Part Number:
LTC1400CS8
Manufacturer:
LT
Quantity:
10 000
Part Number:
LTC1400CS8
Manufacturer:
LINEAR/凌特
Quantity:
20 000
APPLICATIO S I FOR ATIO
LTC1400
where N is the effective number of bits of resolution and
S/(N + D) is expressed in dB. At the maximum sampling
rate of 400kHz, the LTC1400 maintains very good ENOBs
up to the Nyquist input frequency of 200kHz (refer to
Figure 3).
Total Harmonic Distortion
Total harmonic distortion (THD) is the ratio of the RMS
sum of all harmonics of the input signal to the fundamental
itself. The out-of-band harmonics alias into the frequency
band between DC and half of the sampling frequency. THD
is expressed as:
8
Figure 2b. LTC1400 Nonaveraged, 4096 Point FFT
Plot with 200kHz Input Frequency in Bipolar Mode
Distortion vs Input Frequency in Bipolar Mode
Figure 3. Effective Bits and Signal-to-Noise +
–100
–110
–120
–60
–10
–20
–30
–40
–50
–70
–80
–90
12
11
10
9
8
7
6
5
4
3
2
1
0
0
10k
0
f
f
SINAD = 72.1dB
THD = – 80dB
f
SAMPLE
IN
SAMPLE
20
= 199.121kHz
U
40
= 400kHz
= 400kHz
INPUT FREQUENCY (Hz)
FREQUENCY
60
FREQUENCY (kHz)
NYQUIST
80 100
U
100k
120
140
W
160
180
1400 F02b
1400 F03
200
1M
74
68
62
56
50
U
where V1 is the RMS amplitude of the fundamental fre-
quency and V2 through Vn are the amplitudes of the second
through nth harmonics. THD vs input frequency is shown
in Figure 4. The LTC1400 has good distortion performance
up to the Nyquist frequency and beyond.
Intermodulation Distortion
If the ADC input signal consists of more than one spectral
component, the ADC transfer function nonlinearity can
produce intermodulation distortion (IMD) in addition to
THD. IMD is the change in one sinusoidal input caused
by the presence of another sinusoidal input at a different
frequency.
If two pure sine waves of frequencies fa and fb are applied
to the ADC input, nonlinearities in the ADC transfer func-
tion can create distortion products at sum and difference
frequencies of mfa ± nfb, where m and n = 0, 1, 2, 3, etc.
For example, the 2nd order IMD terms include (fa + fb)
and (fa – fb) while the 3rd order IMD terms includes (2fa
+ fb), (2fa – fb), (fa + 2fb) and (fa – 2fb). If the two input
sine waves are equal in magnitude, the value (in decibels)
of the 2nd order IMD products can be expressed by the
following formula.
IMD fa fb
THD
Figure 4. Distortion vs Input Frequency in Bipolar Mode
(
=
20
±
–100
log
–10
–20
–30
–40
–50
–60
–70
–80
–90
0
10k
)
=
f
SAMPLE
V
20log
2
3RD HARMONIC
2
= 400kHz
+
INPUT FREQUENCY (Hz)
V
Amplitude at (
3
2
Amplitude at fa
100k
2ND HARMONIC
+
V
1
V
4
2
THD
+…
fa fb
Vn
1400 F04
±
2
1M
)
1400fa


