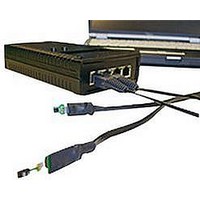
EK-H4 SENSIRION, EK-H4 Datasheet - Page 5

EK-H4
Manufacturer Part Number
EK-H4
Description
EVALUATION KIT, HUMIDITY
Manufacturer
SENSIRION
Datasheet
1.EK-H4.pdf
(7 pages)
Datasheet EK-H4
Figure 6 EK-H4 software window before measurement starts.
Sensors are displayed in different colors.
Measurements are started and stopped by the Start/Stop
button. The measured data are displayed in the
Measurement Data table. The measurements which are
displayed in this table can be selected in the context menu
which appears when the right mouse button is clicked on
the table.
Two plots are available, which display the progress of a
measurement over time. The measurement can be
selected in the list below the plot. The scale of the axes
can be altered by pressing the left mouse button on the
axis and moving the mouse. The plot can be dragged
using the left mouse button. The right mouse button can
be used to display a context menu, which offers functions
to print or copy the plot, or to set auto-scale options for the
axes.
Figure 7 Software surface during measurement. Displayed
values may be selected via menus at the bottom of the window.
www.sensirion.com
4.5 Temperature and Humidity Measurement
Version 1.1 – May 2010
Relative humidity and temperature data are measured by
the sensors. From this data dew point and absolute
humidity values are derived.
Power consumption values are calculated based on
sensor type and setting parameters. All these entities may
be displayed in the graphs – to be selected by the menus
at the bottom of the window. Please note: These data are
not measured but simulated.
The Data Handling section contains controls for settings
which affect all connected sensors. If SHT7x and SHT2x
sensors are connected simultaneously only features from
SHT7x sensors apply. By using only SHT2x sensors the
full range of settings can be used. After disconnection
default configuration is put in place.
Sensor Voltage
Temp. resolution
Humidity resolution
Heater
Measurement interval
Table 3
The data displayed in the measurement plots is kept in
memory. The measured values can be exported to a CSV
file using the menu item File/Export Data. The
measurement data can be cleared with the Clear Data
button. Because the data memory is limited, long-running
measurements should be logged directly to disk. Logging
can be started and stopped using the menu item File/Log
to File.
Information about the sensors and evaluation kits can be
displayed with the Properties command in the context
menu of the cells in the Sensor Select table.
4.6 Calculated Values
4.7 Settings
4.8 Data Logging and Data Export
4.9 Sensor and EK-H4 Properties
Parameter ranges for the different sensor types.
SHT2x
2.1…3.6 V
11, 12, 13, 14 Bit
8, 10, 11, 12 Bit
On, Off
1 … 1440 s
SHT7x
2.1…3.6 V
12, 14 Bit
8, 12 Bit
On, Off
1 … 1440 s
5/7


