MCBTMPM330 Keil Software, MCBTMPM330 Datasheet - Page 2
MCBTMPM330
Manufacturer Part Number
MCBTMPM330
Description
MCU, MPU & DSP Development Tools EVAL BOARD FOR TOSHIBA TMPM330x
Manufacturer
Keil Software
Datasheet
1.MCBTMPM330.pdf
(2 pages)
Specifications of MCBTMPM330
Processor To Be Evaluated
TMPM330FDFG
Interface Type
USB, JTAG
Core
Cortex-M3
Lead Free Status / RoHS Status
Lead free / RoHS Compliant


Real-Time Trace using SWV
This example demonstrates the value of Real-Time Trace using the
Serial Wire Viewer (SWV) features of TMPM330 microcontrollers.
It can be found at:
To use this example:
ULINK-ME
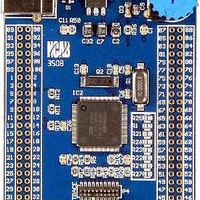
Prototyping with MCBTMPM330
The MCBTMPM330 routes all the peripheral ports of the
TMPM330 device to a 0.1inch prototyping grid with a DIP form
factor.
The numbers next to the prototyping holes match the numbers of
the device pins they connect to.
The board schematics can be downloaded from
http://www.keil.com/mcbtmpm330/mcbtmpm330-schematics.pdf
The preferred way to access the TMPM330 peripheral ports is to
solder rows of pins to the prototyping grid.
This way the board may be stacked onto:
designs
A breadboard, for rapid, flexible prototyping of TMPM330-based
A custom PCB populated with peripheral connectors
Connect to the MCBTMPM330 board with ULINK2 or
Select target build option - TMPM330 Flash
Compile and download to Flash.
Open a Logic Analyzer Window
The A/D converter output and the status of the LEDs are
displayed in the Logic Analyzer Window. These values change as
you move the potentiometer.
Start Debug mode.
C:\Keil\ARM\Boards\Keil\MCBTMPM330\Blinky
View - Logic Analyzer Window
Using the MCBTMPM330 Evaluation Board
www.keil.com
Running Blinky in Simulation
The Simulator Target of the Blinky example demonstrates the
extra debug features of Vision when running in simulation
It can be found at:
To use this example in simulation:
Instruction Trace on MCBTMPM330
The TMPM330FDFG device on the MCBTMPM330 implements an
Embedded Trace Macrocell (ETM) and a 4-bit trace port. This port
is connected to the P4 TRACE connector.
MDK-ARM supports ETM instruction trace on Cortex-M3
devices via the Signum JTAGjet-Trace emulator.
To do instruction trace on MCBTMPM330:
Enable Trace Recording
Select target build option - Simulator
Open the Performance Analyzer and Logic Analyzer Windows
The Code Coverage Window shows what percentage of the
instructions of each function have been executed
The Performance Analyzer Window shows how much time the
processor has spent in each function
Connect JTAGjet-Trace to the P4 connector
Connect µVision to JTAGjet-Trace
Display the trace records in the disassembly window
Compile project
Start Debug mode
Step through the code
Start Debug mode.
Run the application
Halt the execution
C:\Keil\ARM\Boards\Keil\MCBTMPM330\Blinky
View - Performance Analyzer Window
View - Code Coverage Window
Project - Options for Target
Debug Tab - Select Signum Systems JTAGjet
Debug - Enable/Disable Trace Recording
Debug - View Trace Records
.
Related parts for MCBTMPM330
Image
Part Number
Description
Manufacturer
Datasheet
Request
R

Part Number:
Description:
Development Software PROF DEV KIT C166 uVISION & COMP & RTX
Manufacturer:
Keil Software
Part Number:
Description:
Development Software MCU DEV KIT FOR ARM uVISION & C++ & RTX
Manufacturer:
Keil Software
Part Number:
Description:
Development Software MCU DEV KIT FOR ARM 1 YR TERM LIC
Manufacturer:
Keil Software
Part Number:
Description:
Development Software MCU DEV KIT FOR ARM uVISION & C++ COMP
Manufacturer:
Keil Software
Part Number:
Description:
Development Software PROF DEV KIT C51 uVISION & COMP & RTX
Manufacturer:
Keil Software
Part Number:
Description:
Development Software PROF DEV KIT C251 1 YR TERM LIC
Manufacturer:
Keil Software
Part Number:
Description:
Development Software PROF DEV KIT C166 1 YR TERM LIC
Manufacturer:
Keil Software
Part Number:
Description:
Development Software DEVELOPER'S KIT C251 1 YR TERM LIC
Manufacturer:
Keil Software
Part Number:
Description:
Development Software DEVELOPER'S KIT FOR CA251 + uVISION
Manufacturer:
Keil Software
Part Number:
Description:
Development Software DEVELOPER'S KIT FOR C251 V4 FLOATING LIC
Manufacturer:
Keil Software
Part Number:
Description:
Development Software PROF DEV KIT C166 W/ FLOATING LICENSE
Manufacturer:
Keil Software
Part Number:
Description:
Development Software MCU DEV KIT FOR ARM W/ FLOATING LICENSE
Manufacturer:
Keil Software
Part Number:
Description:
Development Software PROF DEV KIT C51 W/ FLOATING LICENSE
Manufacturer:
Keil Software
Part Number:
Description:
Development Software SOFTWARE SUPPORT C++ uVISION & COMPILERS
Manufacturer:
Keil Tools

Part Number:
Description:
Development Software SOFTWARE SUPPORT C++ uVISION & COMPILERS
Manufacturer:
Keil Software