GLK12232-25-SM Matrix Orbital, GLK12232-25-SM Datasheet - Page 19
GLK12232-25-SM
Manufacturer Part Number
GLK12232-25-SM
Description
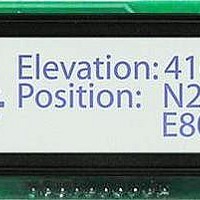
LCD Graphic Display Modules & Accessories White Background Blue Text
Manufacturer
Matrix Orbital
Datasheet
1.GLK12232-25-SM.pdf
(42 pages)
Specifications of GLK12232-25-SM
Pixel Density
122 x 32
Module Size (w X H X T)
86 mm x 35 mm x 14.4 mm
Viewing Area (w X H)
60.2 mm x 18 mm
Backlighting
White
Background Color
Blue, White
Operating Temperature Range
- 20 C to + 70 C
Attached Touch Screen
No
Product
Graphic LCD Module
Style
LCD Graphic Display
Interface
RS-232, I2C
Lead Free Status / RoHS Status
Lead free / RoHS Compliant
Available stocks
Company
Part Number
Manufacturer
Quantity
Price
Company:

Part Number:
GLK12232-25-SM-R14
Manufacturer:
Matrix Orbital
Quantity:
135


5.2.6 Draw Solid Rectangle (254 120 [color][x1][y1][x2][y2])
corner is specified by (x1,y1) and the bottom right corner by (x2,y2). Since this command involves consid-
erable processing overhead, we strongly recommend the use of flow control, particularly if the command
is to be repeated frequently.
constantly being updated from, say, a temperature sensor.
5.2.7 Initialize Bar Graph (254 103 [ref][type][x1][y1][x2][y2])
from (x1,y1) (top left) to (x2,y2) (bottom right). A maximum of 16 bar graphs with reference numbers from
0 to 15 can be initialized as;
The bar graphs may be located anywhere on the display, but if they overlap they will not display properly.
This command doesn’t actually draw the graph, it must be ’filled in’ using the Write to bar graph command,
described below. The unit saves time by only drawing that part of the bar graph which has changed from the
last write, so the representation on the screen may not survive a screen clear or other corruptive action. A
write of value zero, followed by new values will restore the proper look of the bar graph.
5.2.8 Write to Bar Graph (254 105 [reference number][value])
bar graph [reference number] to value [value]. [value] is given in pixels and should not exceed the available
height / width of the graph. (If it does, the graph will simply be written to its maximum size.)
5.2.9 Display Saved Bitmap (254 98 [reference number][x][y])
the screen at pixel location (x, y) where this location defines the top left corner of the bitmap. Bitmaps and
fonts may use the same reference numbers, for example it is possible to have both a bitmap 1 and a font 1.
Matrix Orbital
This command draws a solid rectangle in the specified color (0 = white, non-zero = black). The top left
This procedure is common for monitoring applications where there is a ’field’ on the display that is
This command initializes a bar graph referred to by number [reference number] of type [type] with size
• [type = 0] Vertical bottom referenced
• [type = 1] Horizontal left referenced
• [type = 2] Vertical top referenced
• [type = 3] Horizontal right referenced
Once the bar graph has been initialized it can be ’filled in’ using this command. This command sets the
This command causes a previously stored bitmap referenced by [reference number] to be displayed to
NOTE It is important that [x1] is less than [x2], and [y1] is less than [y2].
NOTE
mogd.exe.
The reference number is established when the bitmap is saved, normally using
GLK12232-25-SM
15
Related parts for GLK12232-25-SM
Image
Part Number
Description
Manufacturer
Datasheet
Request
R

Part Number:
Description:
LCD GRAPHIC DISPL 122X32 WHT BLU
Manufacturer:
Matrix Orbital
Datasheet:

Part Number:
Description:
LCD GRAPHIC DISPL 122X32 WHT/BLU
Manufacturer:
Matrix Orbital
Datasheet:

Part Number:
Description:
LCD GRAPHIC DISPL 122X32 WHT/BLU
Manufacturer:
Matrix Orbital
Datasheet:

Part Number:
Description:
LCD GRAPHIC DISPL 122X32 BLU/WHT
Manufacturer:
Matrix Orbital
Datasheet:

Part Number:
Description:
LCD GRAPHIC DISPL 122X32 WHT/BLK
Manufacturer:
Matrix Orbital
Datasheet:
Part Number:
Description:
LCD GRAPHIC DISPL 122X32 WHT BLU
Manufacturer:
Matrix Orbital
Datasheet:
Part Number:
Description:
LCD GRAPHIC DISPL 122X32 BLU/WHT
Manufacturer:
Matrix Orbital
Datasheet:
Part Number:
Description:
LCD GRAPHIC DISPL 122X32 WHT BLU
Manufacturer:
Matrix Orbital
Datasheet:
Part Number:
Description:
LCD GRAPHIC DISPL 122X32 BLU WHT
Manufacturer:
Matrix Orbital
Datasheet:
Part Number:
Description:
LCD GRAPHIC DISPL 122X32 WHT BLU
Manufacturer:
Matrix Orbital
Datasheet:

Part Number:
Description:
VFD DISPLAY 16X2 SER/I2C
Manufacturer:
Matrix Orbital
Datasheet:

Part Number:
Description:
VFD ALPHA/NUM DISPL 20X2 SER/I2C
Manufacturer:
Matrix Orbital
Datasheet:

Part Number:
Description:
VFD ALPHA/NUM DISPL 16X2 SER/I2C
Manufacturer:
Matrix Orbital
Datasheet:
Part Number:
Description:
VFD ALPHA/NUM DISPL 20X2 SER/I2C
Manufacturer:
Matrix Orbital
Datasheet: