EA KIT240-7LWTK ELECTRONIC ASSEMBLY, EA KIT240-7LWTK Datasheet - Page 11
EA KIT240-7LWTK
Manufacturer Part Number
EA KIT240-7LWTK
Description
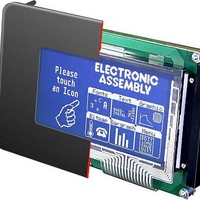
LCD Graphic Display Modules & Accessories Blue/White Contrast RS-232 Snap-In Kit
Manufacturer
ELECTRONIC ASSEMBLY
Datasheet
1.EA_KIT240-7LWTK.pdf
(20 pages)
Specifications of EA KIT240-7LWTK
Pixel Density
240 x 128
Module Size (w X H X T)
144 mm x 104 mm x 39 mm
Viewing Area (w X H)
114 mm x 64 mm
Backlighting
LED
Background Color
Blue, White
Attached Touch Screen
No
Product
Graphic LCD Module
Style
LCD Graphic Display
Interface
RS-232
Lead Free Status / RoHS Status
Lead free / RoHS Compliant


DESCRIPTIONS OF THE VARIOUS GRAPHICS FUNCTIONS
On the following pages you will find detailed descriptions of all of the functions in alphabetical order.
In each case, an enlarged section of the image, 50x32 pixels in size, is shown as a hard copy example,
indicating the contents of the display after the command is executed. The bytes to be transferred are
shown as hex values in the examples.
ESC
Up to 16 bar graphs (no=1..16) can be defined. These can extend to the left (L), right
(R), up (O) or down (U). At its full extent, the bar graph occupies an area from x1,y1
to x2,y2. It is scaled with the start value (no extension) sv (=0..254) and the end
value (full extension) ev (=0..254). The bar graph is always drawn in inverse mode
with the pattern (pat): The background is thus always retained. (Note: When this
command is executed, it defines the bar graph but does not display it).
Example:
Bar graph no. 1, which extends upwards, is defined. When it is fully extended, it takes up an area from 4,2 to
9,30. The start and end values correspond to a 4..20 mA display. (The diagram shows the bar graph fully
extended, as represented with $42 $01 $14.)
ESC
The bar graph with the number n1 (1..16) is set to the new value (sv <= value <= ev).
If value > ev, the end value (ev) is displayed. The bar graph must be defined first
(see above).
Example:
Bar graph no. 1 defined in the above example is set to a value of 10.
ESC
Copies the entire contents of the display to the clipboard.
Example:
Saves the entire contents of the display to the clipboard so that the screen can subsequently be restored. The
contents of the display do not change.
ESC
Copies an area from the upper left corner (x1,y1) to the lower right corner (x2,y2) to the clipboard.
Example:
Saves the area from 0,0 to 23,27 so that the screen can subsequently be restored. The contents of the display
do not change.
ESC
Copies the the area last saved from the clipboard back to the display. Destination: the original coordinates.
Example:
Restores the area last saved.
ESC
Copies the area last saved on the clipboard to a new position (x1,y1) on the display.
Example:
Copies the area last saved to the point 10,32.
B
$1B
B
$1B
C
$1B
C
$1B
C
$1B
C
$1B
L/R/O/U no x1 y1 x2 y2 sv ev pat
$42 $4F
no value
$42 $01
B
$43 $42
S
$43 $53
R
$43 $52
K
$43 $4B
x1
x1
$01
$0A
y1 x2 y2
$00
y1
$0A $20
$04
$00
$02
$17
$09
$1B
Save contents of display to clipboard
$1E $04
$14
Copy area from clipboard
$01
EA KIT240-7
Save area to clipboard
Define bar graph
Draw bar graph
Restore area
1 1
Related parts for EA KIT240-7LWTK
Image
Part Number
Description
Manufacturer
Datasheet
Request
R

Part Number:
Description:
Display Development Tools StrEval Kit Blk-Wht w/ Intf Exp and CD
Manufacturer:
ELECTRONIC ASSEMBLY
Datasheet:
Part Number:
Description:
Display Development Tools StrEval Kit Blue-Wht w/ Intf Exp and CD
Manufacturer:
ELECTRONIC ASSEMBLY
Datasheet:
Part Number:
Description:
Display Development Tools StrEval Kit Blue-Wht w/ Intf Exp and CD
Manufacturer:
ELECTRONIC ASSEMBLY
Datasheet:
Part Number:
Description:
KIT LPC3141 SODIMM 66X48 200POS
Manufacturer:
Embedded Artists
Datasheet:
Part Number:
Description:
KIT LPC3152 SODIMM 66X48 200POS
Manufacturer:
Embedded Artists
Datasheet:
Part Number:
Description:
KIT LPC3250 259 WITH QVGA
Manufacturer:
Embedded Artists
Datasheet:

Part Number:
Description:
LCD Graphic Display Modules & Accessories Blue/White Contrast RS-232 Snap-In Kit
Manufacturer:
ELECTRONIC ASSEMBLY
Datasheet:

Part Number:
Description:
LCD Graphic Display Modules & Accessories Blue/White Contrast RS-232 Snap-In Kit
Manufacturer:
ELECTRONIC ASSEMBLY
Datasheet:

Part Number:
Description:
LCD Graphic Display Modules & Accessories Yel/Green Backlight RS-232 Snap-In Kit
Manufacturer:
ELECTRONIC ASSEMBLY
Datasheet:

Part Number:
Description:
LCD Touch Panels Touchpanel Analog for DOGM128-6
Manufacturer:
ELECTRONIC ASSEMBLY
Datasheet:
Part Number:
Description:
LCD Touch Panels Touchpanel Analog For DOGS102
Manufacturer:
ELECTRONIC ASSEMBLY
Datasheet:
Part Number:
Description:
LCD Touch Panels Touchpanel Analog For DOGXL160
Manufacturer:
ELECTRONIC ASSEMBLY
Datasheet:
Part Number:
Description:
LCD Touch Panels Touchpanel Analog For DOG-L128-6
Manufacturer:
ELECTRONIC ASSEMBLY
Datasheet:

Part Number:
Description:
LED Displays Bezel 017-xx Series 75.0x24.2/ 91.0x36.4
Manufacturer:
ELECTRONIC ASSEMBLY
Datasheet: