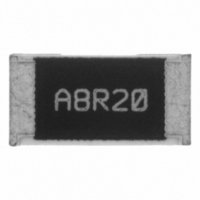
CPA2512Q8R20FS-T10 Susumu, CPA2512Q8R20FS-T10 Datasheet - Page 2

CPA2512Q8R20FS-T10
Manufacturer Part Number
CPA2512Q8R20FS-T10
Description
RES 8.2 OHM 16W 1% 2512 SMD
Manufacturer
Susumu
Series
CPA2512r
Specifications of CPA2512Q8R20FS-T10
Resistance (ohms)
8.2
Power (watts)
16W
Composition
Thin Film
Temperature Coefficient
±25ppm/°C
Tolerance
±1%
Size / Dimension
0.248" L x 0.126" W (6.30mm x 3.20mm)
Height
0.028" (0.70mm)
Lead Style
Surface Mount (SMD - SMT)
Package / Case
2512 (6432 Metric)
Resistance In Ohms
8.20
Case
2512 (6432 metric)
Lead Free Status / RoHS Status
Lead free / RoHS Compliant
Features
-
Other names
CPA25Q8.2TR
CPA2512 Series Chip Power Resistors
A thermal performance plot is a detailed derating
curve that accounts for the board/heat-sink interface
in addition to the ambient/heat-sink temperature. A
standard derating curve only accounts for the
ambient/heat-sink temperature and therefore must
assume a specific rate of heat flow from the chip
power resistor (usually an absolute best case
scenario), which can be very misleading considering
the wide variety of board design and construction
limitations that can push the effective thermal
resistance of the board/heat-sink interface far from
the best case scenario.
The thermal performance plots provide a means of
identifying the recommended maximum power
rating based on the maximum acceptable peak
temperature rise and effective thermal resistance
of the board/heat-sink interface.
provides a board design engineer perspective on
the
characteristics of an existing board/heat-sink
interface
capability.
If the effective thermal resistance between the chip
power resistor and board/heat-sink interface is
known, then the recommended maximum power
rating would be determined as follows.
1. Calculate the maximum “peak surface
2. Draw a horizontal line across the plot at the
3. Draw a vertical line up the plot at the known
Where T
155°C) and T
temperature at 100% rated power.
comfortable limit for the CP series chip power
resistors in determining the desired power rating.
Though, the CP series chip power resistors can
tolerate a continuous 190°C and greater peak
surface temperature and still meet the criteria for Life
testing as detailed in the environmental performance
specifications section of the datasheets.
T
comfortable safeguard against uncertainties.
temperature rise”, T
uc
potential
maximum “peak surface temperature rise”
determined in step 1.
“thermal resistance of board”/heat-sink
interface.
= 155°C for this determination offers a
to
uc
= upper category temperature (generally
enable
for
ma
= maximum ambient/heat-sink
improving
higher
rp
= T
uc
– T
power
ma
In addition, it
the
(°C)
155°C is a
handling
thermal
Using a
Using the Thermal Performance Plots
1. Same as step 1 in previous section.
2. With the selected chip power resistor
3. Increase the power until the peak surface
4. Draw a horizontal line across the plot at the
If the effective thermal resistance is not known, it
can be determined by measuring the peak
surface temperature rise of a chip power resistor
as a function of power and comparing the result
with the corresponding thermal performance plot
as follows.
Knowing the effective thermal resistance of the
board/heat-sink interface enables identifying the
most appropriate part. If the particular part you
tested with does not quite meet your needs,
consider the BeO or AlN material options, a
larger
configuration.
perspective on the potential for improving, or how
much improvement is needed to the thermal
characteristics of the board/heat-sink interface.
4. The intersection of these two lines is the
mounted to the intended board/heat-sink
interface, record the surface temperature at
0W applied power.
temperature at equilibrium has been raised by
the amount determined in step 1 and record
the power level.
rating determined for you application for that
particular board/heat-sink interface.
maximum “peak surface temperature rise”
determined in step 1.
intersects the power level determined in step
3, draw a line straight down to identify the
effective
board/heat-sink interface (refer to Plot 1 for
example).
Use a thermal imaging camera (blacken marking
with sharpie pen) or a thermocouple thermally
secured to the surface for measuring temperature.
The 0W temperature can be room temperature or
regulated at T
conductivity reduction of materials with increasing
temperature (not to be confused with power vs. T
non-linearity).
Depending on the 0W temperature the target peak
surface temperature may be T
at T
recommended
(refer to Plot 1 for example).
ma
) or room temperature + T
chip
thermal
size
ma
Else, this may offer some
to account for slight thermal
or
This would be the power
maximum
resistance
alternative
uc
rp
Where this line
.
(for 0W regulated
power
electrode
of
rating
the
rp


