HDSP-4832 Avago Technologies US Inc., HDSP-4832 Datasheet - Page 7
HDSP-4832
Manufacturer Part Number
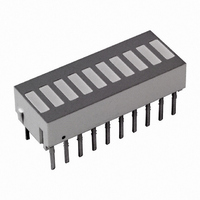
HDSP-4832
Description
LED BAR GRAPH 10SEG RED/YLW/GRN
Manufacturer
Avago Technologies US Inc.
Specifications of HDSP-4832
Color
Green (x 3), Red (x 3), Yellow (x 4)
Voltage Rating
2.1V Green, 2.1V Red, 2.2V Yellow
Current
30mA Green, 30mA Red, 20mA Yellow
Lens Style/size
Rectangle, 5.08mm x 1.52mm
Configuration
10 Segment
Mounting Type
Through Hole
Number Of Digits
10
Illumination Color
Red, Yellow, Green
Wavelength
635 mm
Operating Voltage
2.1 V
Operating Current
30 mA
Maximum Operating Temperature
+ 85 C
Minimum Operating Temperature
- 40 C
Luminous Intensity
3500 mcd
Display Type
Bar Graph
Temperature, Operating
-40 to +85 °C
Temperature, Soldering
260°C For 3 Sec.
Lead Free Status / RoHS Status
Lead free / RoHS Compliant
Lens Type
-
Lead Free Status / Rohs Status
Lead free / RoHS Compliant
Other names
516-1236-5


Electrical/Optical
These versatile bar graph arrays are composed of ten
light emitting diodes. The light from each LED is optically
stretched to form individual elements. The Red (HDSP-
4820) bar graph array LEDs use a p-n junction diffused
into a GaAsP epitaxial layer on a GaAs substrate. The Al-
GaAs Red (HLCP-J100) bar graph array LEDs use double
heterojunction AlGaAs on a GaAs substrate. HER (HDSP-
4830) and Yellow (HDSP-4840) bar graph array LEDs use
a GaAsP epitaxial layer on a GaP substrate. Green (HDSP-
4850) bar graph array LEDs use liquid phase GaP epi-
taxial layer on a GaP substrate. The multicolor bar graph
arrays (HDSP-4832/4836) have HER, Yellow, and Green
LEDs in one package. These displays are designed for
strobed operation. The typical forward voltage values
can be scaled from Figures 5 and 11. These values should
be used to calculate the current limiting resistor value
and typical power consumption. Expected maximum V
values for driver circuit design and maximum power dis-
sipation may be calculated using the V
Standard Red HDSP-4820 series
V
For: I
AlGaAs Red HLCP-J100 series
V
For: I
V
For: I
HER (HDSP-4830) and Yellow
(HDSP-4840) series
V
For: 5 mA d I
V
For: I
Green (HDSP-4850) series
V
For: I
For product information and a complete list of distributors, please go to our web site:
Avago, Avago Technologies, and the A logo are trademarks of Avago Technologies in the United States and other countries.
Data subject to change. Copyright © 2005-2009 Avago Technologies. All rights reserved. Obsoletes AV01-0277EN
AV02-1798EN - November 5, 2009
F
F
F
F
F
F
MAX = 1.8 V + I
MAX = 1.8 V + I
MAX = 2.0 V + I
MAX = 1.6 + I
MAX = 1.75 + I
MAX = 2.0 + I
Peak
Peak
Peak
Peak
Peak
t 5 mA
d 20 mA
t 20 mA
t 20 mA
> 5 mA
Peak
Peak
Peak
d 20 mA
Peak
Peak
Peak
Peak
(45 :)
(50 :)
(38 :)
(10 :)
(20 :)
(10 :)
FMAX
models:
F
www.avagotech.com
Figures 4 and 10 allow the designer to calculate the lu-
minous intensity at different peak and average currents.
The following equation calculates intensity at different
peak and average currents:
I
SHEET)K
Where:
I
sity resulting from I
I
I
I
K
scaled from Figure 4 or 10.
I
resulting from I
For example, what is the luminous intensity of an HDSP-
4830 driven at 50 mA peak 1/5 duty factor?
I
I
K
I
Therefore
I
V
V
F
F
V
V
F
F
V
V
AVG is the desired time averaged LED current.
AVG DATA SHEET is the data sheet test current for
peak
AVG = (50 mA) (0.2) = 10 mA
AVG DATA SHEET = 10 mA
peak
AVG = (I
AVG is the calculated time averaged luminous inten-
AVG = (10 mA/10 mA) (1.3) (3500 mcd) = 4550 mcd
DATA SHEET.
DATA SHEET is the data sheet luminous intensity,
DATA SHEET = 3500 Pcd
is the relative efficiency at the peak current,
= 1.3
peak
F
AVG/I
)(I
V
F
DATA SHEET)
F
AVG DATA SHEET.
AVG DATA
F
AVG.
Related parts for HDSP-4832
Image
Part Number
Description
Manufacturer
Datasheet
Request
R

Part Number:
Description:
Seven-Segment Numeric LED Display,4-CHARACTER,Green,DIP
Manufacturer:
Avago Technologies US Inc.
Datasheet:
Part Number:
Description:
Seven-Segment Numeric LED Display,4-CHARACTER,Green,DIP
Manufacturer:
Avago Technologies US Inc.
Datasheet:
Part Number:
Description:
Seven-Segment Numeric LED Display,4-CHARACTER,Green,DIP
Manufacturer:
Avago Technologies US Inc.
Datasheet:
Part Number:
Description:
Seven-Segment Numeric LED Display,4-CHARACTER,Green,DIP
Manufacturer:
Avago Technologies US Inc.
Datasheet:
Part Number:
Description:
Seven-Segment Numeric LED Display,4-CHARACTER,Green,DIP
Manufacturer:
Avago Technologies US Inc.
Datasheet:

Part Number:
Description:
LED 7-SEG 14.2MM 2DIG CC HER RHD
Manufacturer:
Avago Technologies US Inc.
Datasheet:

Part Number:
Description:
LED 7-SEG 14.2MM 2DIG CA HER RHD
Manufacturer:
Avago Technologies US Inc.
Datasheet:

Part Number:
Description:
DISPLAY 7SEG 4DIG GREEN CA 0.56"
Manufacturer:
Avago Technologies US Inc.
Datasheet:
Part Number:
Description:
DISPLAY 7SEG 4DIG GREEN CC 0.56"
Manufacturer:
Avago Technologies US Inc.
Datasheet:
Part Number:
Description:
DISPLAY 7SEG 4DIG HER CC 0.56"
Manufacturer:
Avago Technologies US Inc.
Datasheet:
Part Number:
Description:
DISPLAY 7SEG 4DIG GREEN CC 0.56"
Manufacturer:
Avago Technologies US Inc.
Datasheet:
Part Number:
Description:
DISPLAY 7SEG 4DIG HER CA 0.56"
Manufacturer:
Avago Technologies US Inc.
Datasheet:
Part Number:
Description:
DISPLAY 7SEG 4DIG GREEN CA 0.56"
Manufacturer:
Avago Technologies US Inc.
Datasheet:

Part Number:
Description:
DISPLAY 7SEG 4DIG HER CA 0.56"
Manufacturer:
Avago Technologies US Inc.
Datasheet:
Part Number:
Description:
DISPLAY 7SEG 4DIG GREEN CC 0.56"
Manufacturer:
Avago Technologies US Inc.
Datasheet: