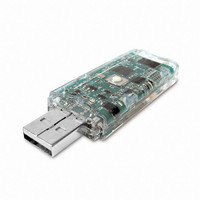
VR001 Mide Technology Corporation, VR001 Datasheet

VR001
Specifications of VR001
Related parts for VR001
VR001 Summary of contents
Page 1
FEATURES Free Analysis Software - click here for web page Simple and Easy to Use Small and Lightweight High Speed - 3.2 KHz Sampling Rate Rechargeable Characterizes Vibration Profile for Energy Harvesting Applications Dust Proof Enclosure Simple Analysis & Configuration ...
Page 2
PERFORMANCE PLOTS Noise Distribution | X Axis -0.06 -0.04 -0.02 0 Deviation from Mean (G, one bin per LSB) Noise Distribution | Z Axis -0.1 -0.08 -0.06 -0.04 -0.02 ...
Page 3
PERFORMANCE PLOTS samples which contain this amount of error. The RMS error (or standard error) is the error value at which 68.2% of samples (one standard deviation) have an error lower than the RMS value. Frequency roll off data was ...
Page 4
OPERATION To Charge your Slam Stick™ Leave the device plugged into the USB port for charging. A green LED will signify that the device is charging. The LED will go out when a full charge has been reached. A full ...
Page 5
OPERATION ‘Full’ sample rate (up to 3200Hz) ‘Full’ leaves the accelerometer in active mode and the Flash memory powered, and uses the same sample rate as the actual recording. This mode consumes more power (~300uA @ 3200Hz), but will trigger ...
Page 6
OPERATION Downloading and Analyzing the Data For technical performance reasons, the Slam Stick™ stores its data in a raw binary format, which requires additional software to interpret or convert to a more accessible format. There are currently two ways to ...
Page 7
OPERATION Usage: ss2csv <filename.dat> Please enter name of file to read: data.dat Input file is: data.dat Reading recording 0 from block 0x0000 Rec. size: 32339 samples (194048 bytes) in about 11 seconds (327695 ticks) Done parsing recording 0 Press any ...
Page 8
OPERATION The following Figure windows will be displayed: 1) Time history ( Fourier Transform (X) 3) Fourier Transform (Y) 4) Fourier Transform (Z) 5) 2-D Fourier Transform (X) 6) 2-D Fourier Transform (Y) 7) 2-D Fourier Transform ...
Page 9
OPERATION Figure 7: Z Frequency 2D File Edit View Insert 2-D Frequency options The 2-D Fourier graph splits frequency data into small time ‘slices’ to visualize time-dependent trends in the frequency data. By default, the full frequency range is shown ...
Page 10
OPERATION quotation marks with nothing in between) for startfreq and endfreq. For example: Command Window ss_view('vib0000.dat', '', C:\stuff\> pvr2csv J:\data.dat will ceiling the surface plot to 0.5g without affecting the range of displayed frequencies. Non-Windows platforms Pre-compiled binaries are provided ...
Page 11
APPLICATIONS INFORMATION Aliasing Any complex waveform, such as Slam Stick vibration traces, can be expressed as the sum of sinusoidal frequency components. Per Shannon’s Sampling theorem, in any sampled data such as that produced by the Slam Stick, the maximum ...
Page 12
APPLICATIONS INFORMATION Vibration v. Time 2.5 2 1.5 1 0 Figure 2: Time domain response of a commercial jumbo jet during taxiing. A series of vibration recordings were taken during a flight on a commercial jumbo ...
Page 13
APPLICATIONS INFORMATION 0 200 400 Engine spin-up (fundamental + resonant modes Figure 4: 2-D FFT of the time domain data shown in Figure 2. Salient features have been labeled. peak amplitudes, ...
Page 14
APPLICATIONS INFORMATION axis) and a similarly wide band centered around 380Hz (Z axis). The X axis shows contributions from both of these sources. Unlike the previous case, all of the peak Vibration v. Frequency - 4.5 4 3.5 ...
Page 15
APPLICATIONS INFORMATION 0.07 0.06 0.05 0.04 0.03 0.02 0. Time (s) 30 Figure 8: 2-D FFT of vibration data during cruise (Y axis) 0.03 0.025 0.02 0.015 0.01 0.005 ...


