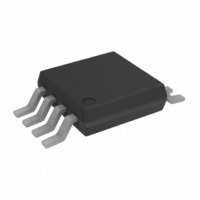
AD7940BRM Analog Devices Inc, AD7940BRM Datasheet - Page 9

AD7940BRM
Manufacturer Part Number
AD7940BRM
Description
IC ADC 14BIT UNIPOLAR 8-MSOP
Manufacturer
Analog Devices Inc
Datasheet
1.AD7940BRJZ-REEL7.pdf
(20 pages)
Specifications of AD7940BRM
Data Interface
DSP, MICROWIRE™, QSPI™, Serial, SPI™
Operating Temperature
-40°C ~ 85°C
Number Of Bits
14
Sampling Rate (per Second)
100k
Number Of Converters
1
Power Dissipation (max)
26.4mW
Voltage Supply Source
Single Supply
Mounting Type
Surface Mount
Package / Case
8-TSSOP, 8-MSOP (0.118", 3.00mm Width)
Resolution (bits)
14bit
Input Channel Type
Single Ended
Supply Voltage Range - Analogue
2.5V To 5.5V
Supply Current
5.2mA
No. Of Pins
8
Sampling Rate
100kSPS
Rohs Compliant
No
Lead Free Status / RoHS Status
Contains lead / RoHS non-compliant
For Use With
EVAL-AD7940CBZ - BOARD EVALUATION AD7940AD7940-DBRD - BOARD EVAL FOR AD7940 STAMP SPI
Lead Free Status / RoHS Status
Contains lead / RoHS non-compliant
Available stocks
Company
Part Number
Manufacturer
Quantity
Price
Company:
Part Number:
AD7940BRMZ
Manufacturer:
ADI
Quantity:
1 000
Part Number:
AD7940BRMZ
Manufacturer:
ADI/亚德诺
Quantity:
20 000
Company:
Part Number:
AD7940BRMZ-REEL7
Manufacturer:
ADI
Quantity:
1 000
TYPICAL PERFORMANCE CHARACTERISTICS
Figure 5 shows a typical FFT plot for the AD7940 at 100 kSPS
sample rate and 10 kHz input frequency. Figure 6 shows the
signal-to-(noise + distortion) ratio performance versus the
input frequency for various supply voltages while sampling at
100 kSPS with an SCLK of 2.5 MHz.
–100
–120
–140
–160
–20
–40
–60
–80
90
85
80
75
0
10
0
Figure 5. AD7940 Dynamic Performance at 100 kSPS
Figure 6. AD7940 SINAD vs. Analog Input Frequency
F
T
SAMPLE
A
= 25
for Various Supply Voltages at 100 kSPS
°
C
= 100kSPS
10k
V
DD
INPUT FREQUENCY (kHz)
= 5.25V
FREQUENCY (kHz)
20k
V
DD
= 2.5V
V
DD
= 4.75V
30k
V
F
F
SNR = 84.48dB
SINAD = 84.35dB
THD = –98.97dB
SFDR = –100.84dB
DD
SAMPLE
IN
= 10kHz
= 4.75V
40k
V
V
V
V
= 100kSPS
DD
DD
DD
DD
= 4.3V
= 3.6V
= 3V
= 2.7V
50k
100
Rev. 0 | Page 9 of 20
Figure 7 shows a graph of the total harmonic distortion versus
the analog input frequency for various supply voltages, while
Figure 8 shows a graph of the total harmonic distortion versus
the analog input frequency for various source impedances (see
the Analog Input section). Figure 9 and Figure 10 show the
typical INL and DNL plots for the AD7940.
110
105
100
110
105
100
95
90
85
80
95
90
85
80
75
70
10
10
V
F
T
F
T
V
V
Figure 7. AD7940 THD vs. Analog Input Frequency
Figure 8. AD7940 THD vs. Analog Input Frequency
DD
SAMPLE
A
SAMPLE
A
DD
DD
= 25
= 25
= 5.25V
= 4.75V
V
= 3V
DD
for Various Supply Voltages at 100 kSPS
°
°
C
C
= 100kSPS
= 100kSPS
= 4.75V
for Various Source Impedances
V
DD
= 3.6V
INPUT FREQUENCY (kHz)
INPUT FREQUENCY (kHz)
V
DD
= 2.5V
V
V
DD
DD
= 2.7V
= 4.3V
R
R
R
R
IN
IN
IN
IN
= 10Ω
= 50Ω
= 100Ω
= 1000Ω
AD7940
100
100


