AFBR-5103TZ Avago Technologies US Inc., AFBR-5103TZ Datasheet - Page 6
AFBR-5103TZ
Manufacturer Part Number
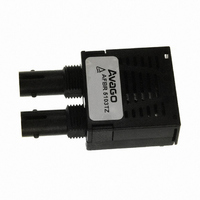
AFBR-5103TZ
Description
TXRX OPT 1X9 100MBPS DUPL ST SIP
Manufacturer
Avago Technologies US Inc.
Datasheet
1.AFBR-5103TZ.pdf
(20 pages)
Specifications of AFBR-5103TZ
Data Rate
100Mbps
Wavelength
1300nm
Applications
General Purpose
Voltage - Supply
4.75 V ~ 5.25 V
Connector Type
ST
Mounting Type
Through Hole
Function
Implement FDDI and ATM at the 100 Mbps/125 MBd rate
Product
Transceiver
Maximum Rise Time
3 ns, 2.2 ns
Maximum Fall Time
3 ns, 2.2 ns
Pulse Width Distortion
0.02 ns
Maximum Output Current
50 mA
Operating Supply Voltage
4.75 V to 5.25 V
Maximum Operating Temperature
+ 70 C
Minimum Operating Temperature
0 C
Package / Case
SIP-9
For Use With
Multimode Glass
Lead Free Status / RoHS Status
Lead free / RoHS Compliant
Other names
516-1982


Application Information
The Applications Engineering group in the Avago Tech-
nologies Optical Communication Division is available to
assist you with the technical understanding and design
trade-offs associated with these transceivers. You can
contact them through your Avago Technologies sales
representative.
The following information is provided to answer some
of the most common questions about the use of these
parts.
Transceiver Optical Power Budget versus Link
Length
Optical Power Budget (OPB) is the available optical power
for a fiber optic link to accommodate fiber cable losses plus
losses due to in-line connectors, splices, optical switches,
and to provide margin for link aging and unplanned losses
due to cable plant reconfiguration or repair.
Figure 4 illustrates the predicted OPB associated with the
transceiver series specified in this data sheet at the Begin-
ning of Life (BOL). These curves represent the attenuation
and chromatic plus modal dispersion losses associated
with the 62.5/125 µm and 50/125 µm fiber cables only.
The area under the curves represents the remaining OPB
at any link length, which is available for overcoming non-
fiber cable related losses.
Avago technologies’ LED technology has produced 1300
nm LED devices with lower aging characteristics than nor-
mally associated with these technologies in the industry.
The industry convention is 1.5 dB aging for 1300 nm LEDs.
The Avago Technologies 1300 nm LEDs will experience less
than 1 dB of aging over normal commercial equipment
mission life periods. Contact your Avago Technologies
sales representative for additional details.
Figure 4 was generated with an Avago Technologies’
fiber optic link model containing the current industry
conventions for fiber cable specifications and the FDDI
PMD and LCF-PMD optical parameters. These parameters
are reflected in the guaranteed performance of the trans-
ceiver specifications in this data sheet. This same model
has been used extensively in the ANSI and IEEE commit-
tees, including the ANSI X3T9.5 committee, to establish
the optical performance requirements for various fiber
optic interface standards. The cable parameters used
come from the ISO/IEC JTC1/SC 25/WG3 Generic Cabling
for Customer Premises per DIS 11801 document and the
EIA/TIA-568-A Commercial Building Telecommunications
Cabling Standard per SP-2840.
Transceiver Signaling Operating Rate Range and BER
Performance
For purposes of definition, the symbol (Baud) rate, also
called signaling rate, is the reciprocal of the shortest symbol
time. Data rate (bits/sec) is the symbol rate divided by the
encoding factor used to encode the data (symbols/bit).
When used in FDDI and ATM 100 Mbps applications the
performance of the 1300 nm transceivers is guaranteed
over the signaling rate of 10 MBd to 125 MBd to the full con-
ditions listed in individual product specification tables.
The transceivers may be used for other applications at
signaling rates outside of the 10 MBd to 125 MBd range
with some penalty in the link optical power budget pri-
marily caused by a reduction of receiver sensitivity. Figure
5 gives an indication of the typical performance of these
1300 nm products at different rates.
These transceivers can also be used for applications which
require different Bit Error Rate (BER) performance. Figure 6
illustrates the typical trade-off between link BER and the
receivers input optical power level.
Figure 4. Optical Power Budget at BOL versus Fiber
Optic Cable Length.
14
12
10
8
6
4
2
0
0.15
0.5
FIBER OPTIC CABLE LENGTH (km)
AFBR-5103Z,
50/125 µm
1.0
AFBR-5103Z, 62.5/125 µm
1.5
2.0
2.5
3.0
3.5
4.0
Related parts for AFBR-5103TZ
Image
Part Number
Description
Manufacturer
Datasheet
Request
R

Part Number:
Description:
650nm FE Transceiver Eval Kit
Manufacturer:
Avago Technologies US Inc.
Datasheet:

Part Number:
Description:
TXRX OPT OC3 MTRJ SFF 2X5DIP
Manufacturer:
Avago Technologies US Inc.
Datasheet:

Part Number:
Description:
TXRX ETHERNET 125MBD MMF 2X5
Manufacturer:
Avago Technologies US Inc.
Datasheet:

Part Number:
Description:
TXRX OPT SFP DGTL 850NM IND
Manufacturer:
Avago Technologies US Inc.
Datasheet:

Part Number:
Description:
TXRX OPT SFF 4/2/1GBD 2X7
Manufacturer:
Avago Technologies US Inc.
Datasheet:

Part Number:
Description:
TXRX OPT SFP 4/2/1GBD 850NM
Manufacturer:
Avago Technologies US Inc.
Datasheet:

Part Number:
Description:
TXRX OPT XFP 10GB/S 850NM
Manufacturer:
Avago Technologies US Inc.
Datasheet:

Part Number:
Description:
TXRX OPT 1X9 100MBPS ST EXT TEMP
Manufacturer:
Avago Technologies US Inc.
Datasheet:

Part Number:
Description:
TXRX OPT 1X9 100MBPS SC EXT TEMP
Manufacturer:
Avago Technologies US Inc.
Datasheet:

Part Number:
Description:
TXRX OPT 1X9 100MBPS DUPLEX SC
Manufacturer:
Avago Technologies US Inc.
Datasheet:

Part Number:
Description:
OPTOCOUPLER GATE DRV 2A 16-SOIC
Manufacturer:
Avago Technologies US Inc.
Datasheet:
Part Number:
Description:
OPTOCOUPLER 2CH 2.5A 16-SOIC
Manufacturer:
Avago Technologies US Inc.
Datasheet:

Part Number:
Description:
OPTOCOUPLER GATE DRV 0.4A 16SOIC
Manufacturer:
Avago Technologies US Inc.
Datasheet:

Part Number:
Description:
OPTOCOUPLER 2.0A 250KHZ 8-DIP
Manufacturer:
Avago Technologies US Inc.
Datasheet:

Part Number:
Description:
OPTOCOUPLER 2.0A 250KHZ GW 8-SMD
Manufacturer:
Avago Technologies US Inc.
Datasheet: